
Data without direction is just noise. In the world of Application Portfolio Management with Sparx Systems, the difference between a stagnant inventory and a strategic roadmap often comes down to one thing: defining the right application portfolio management metrics.
Simply listing your applications isn’t enough. To drive modernization and control costs, you need to measure what matters. Defining specific, actionable metrics allows you to move beyond basic record-keeping to uncover hidden risks, identify technical debt, and spot opportunities for innovation. While Sparx Systems Enterprise Architect (EA) provides the essential modeling structure, Prolaborate brings that data to life, turning abstract models into application portfolio analytics and APM KPIs that leaders, architects, and owners can actually use to drive decisions.
Deploy a standardized APM framework instantly using our industry-proven metamodels and pre-configured patterns.
Define the Right APM KPIs

Before building APM dashboards, the priority must be Defining the Right KPIs for APM. Effective portfolio metrics typically converge from four distinct angles:
Portfolio Shape
Gain clarity on your landscape by tracking application distribution across domains using landscape views for strategic application classification. Assess the strategic-to-legacy ratio and identify redundancies to pinpoint exactly where consolidation can simplify your architecture and reduce complexity.
Health and Risk
Manage stability by monitoring technical debt and end-of-life technologies. Proactively flag high-risk systems involving security or compliance sensitivities to prioritize remediation efforts before hidden issues escalate into critical failures.
Cost and Value
Bridge architecture and finance by analyzing spend across platforms. Highlight inefficiencies in low-value applications and track the “Run” versus “Change” cost split to ensure IT investments drive tangible business value.
Change and Modernization
Monitor the pulse of transformation through rationalization roadmaps and modernization waves. Track the momentum of planned changes and the speed of resolving critical technical risks to keep initiatives on schedule.
In Sparx EA, these KPIs are grounded in modeled elements and fields such as applications, capabilities, technologies, scores, and rationalization options. This structural foundation ensures your KPIs are traceable artifacts, not just arbitrary numbers on a slide.
Create APM Dashboards in Prolaborate
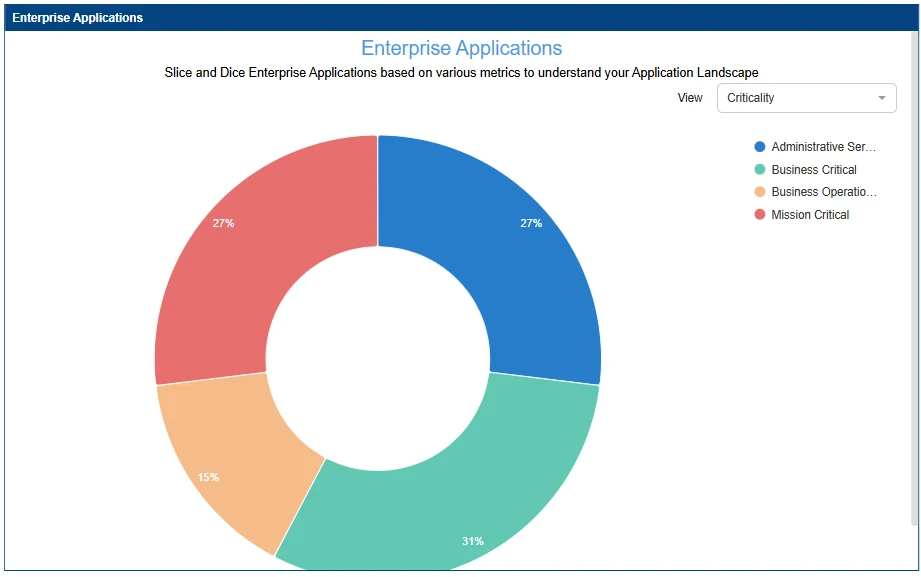
Prolaborate is where application portfolio management metrics evolve from static reports into live decision dashboards. Using specialized Prolaborate analytics widgets, you can start Building APM Dashboards in Prolaborate that cover:
- Inventory and Health:
- Tables: List applications with key fields such as domain, owner, lifecycle, scores, and rationalization options.
- Charts: Break down the portfolio visually by lifecycle phase, hosting type, technology stack, or business domain.
- Risk and Modernization:
- Risk Widgets: Highlight high-risk, low-health, or EOL-technology applications immediately.
- Modernization Views: Visualize candidates for modernization (Rebuild/Replace) against their business value and cost levels.
- Executive Summaries:
- High-Level Tiles: Often implemented using card widgets for instance portfolio snapshots, they display key metrics like “Total Applications,” “High-Risk Apps,” “Legacy Apps,” and “Apps Marked for Retirement”.
- Trend Visuals: Use a select number of visuals to answer critical questions: Where are we now? What is improving or deteriorating?
Because these dashboards are driven directly from the live Sparx Enterprise Architect model, updating the model automatically updates the dashboards. You eliminate the need to build reporting logic twice.
Integrate Sparx EA APM Data with CMDB / ITSM / Finance
Sparx EA acts as the architecture source of truth, while other tools hold granular operational and financial details. To achieve richer analytics, you don’t need to replicate everything into EA, but strategic integration is key. You get the most value by Integrating Sparx EA APM Data into CMDB, ITSM and Financial Systems.
Common Patterns
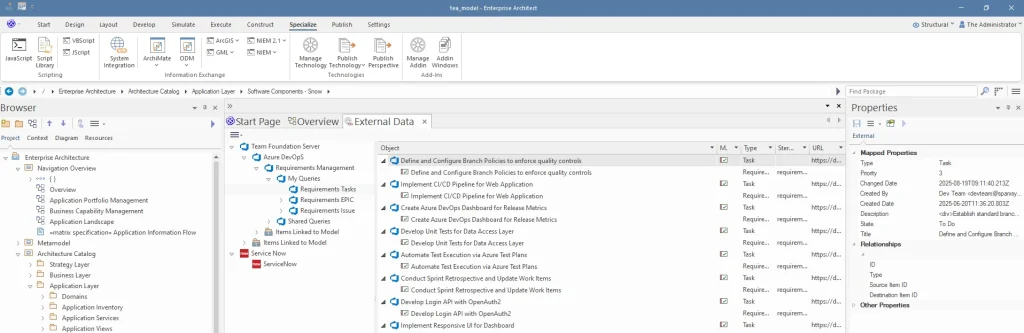
- Sparx EA + CMDB: Use CMDB data (e.g., ServiceNow) to seed or enrich your Enterprise Architect inventory with environments, Configuration Items (CIs), and infrastructure details. EA adds the necessary context: capabilities, processes, integrations, and rationalization status.
- Sparx EA + ITSM: Link applications in Sparx EA to incident and problem data in ITSM tools and delivery pipelines by connecting Sparx EA APM with ALM and DevOps systems. Use this link to highlight applications suffering from high incident volumes or repeated major outages.
- Sparx EA + Finance / ITFM: Import simple cost bands or Total Cost of Ownership (TCO) estimates from finance systems. Use Sparx EA’s structure to visualize where cost sits across domains, platforms, and rationalization options.
In Prolaborate, you can then:
- Show summary fields from these external sources directly on application views (e.g., incident counts, cost bands).
- Filter and report on architecture structures using operational and financial signals, not just static APM KPIs.
The result is analytics that combine architectural context with real–world performance and spend.
Use Analytics for Predictive APM and Modernization
Once you have stable KPIs and integrated data, you can shift from analyzing “what happened” to Using Analytics for Predictive APM and Modernization Planning.
Examples of Predictive Use
- Spotting Clusters of Risk: Identify domains where high-value applications rely on poor technology stacks or EOL components. Pinpoint areas where incident trends are rising while modernization efforts have stalled.
- Identifying Future Legacy: Detect apps with repeated deferrals of modernization decisions or platforms where vendors have announced future EOL dates.
- Supporting What-If Analysis:
- “What if we retired this cluster of low-value apps—what capabilities are affected, and what cost/risk do we remove?”
- “If we standardize on Platform X, which applications can move there, and how many integrations are touched?”
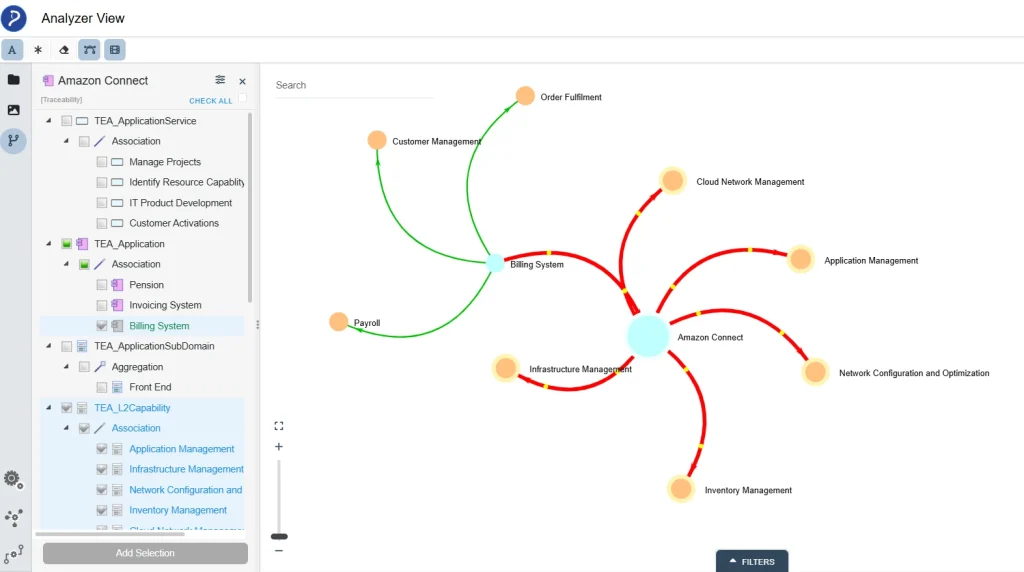
Sparx Enterprise Architect provides the model for relationships and scenarios (Apps → Capabilities → Processes → Integrations). Prolaborate provides the views and filters to explore those scenarios with stakeholders using live data rather than hypothetical lists.
Govern and Operationalize Your APM Analytics
Analytics only deliver value if they are part of a regular APM cadence, not a one-time project. In practice, this requires:
- Roles and Ownership: Define who maintains the APM metamodel and KPIs in Sparx EA, who owns the portfolio dashboards in Prolaborate, and who is responsible for data completeness and quality (per domain or BU).
- Cadence: Establish regular updates for scores and key fields (e.g., quarterly health reviews), schedule portfolio dashboards for steering committees, and align annual rationalization planning with budgeting cycles.
- Data Quality and Improvements: Use Prolaborate views to track missing owners, empty scores, or inconsistent statuses. Agree on small, incremental improvements rather than attempting to “fix everything” at once.
Over time, your APM analytics become:
- Reliable enough for executives to trust.
- Detailed enough for architects and owners to act on.
- Lightweight enough to maintain without a separate reporting project.
Sparx EA remains the model and structure behind the numbers; Prolaborate is the operational window where APM analytics are seen, discussed, and used for decisions.
Discuss your Application Portfolio Management Context, data sources, and governance goals with SSNA’s expert consultants.
The Path to APM Success
The true power of Application Portfolio Management lies not in the data itself, but in the story it tells. By defining the right metrics, visualizing them through dynamic APM dashboards, and integrating operational realities, you transform APM from a static exercise into a strategic engine.
The Sparx Systems APM platform, combining the robust modeling of Enterprise Architect with intuitive Prolaborate analytics provides the essential framework for this transformation. It bridges the gap between technical detail and executive strategy, ensuring that every decision is data-driven and every investment aligns with business value. With these tools in hand, you don’t just manage your portfolio; you master it, driving continuous modernization and securing a competitive edge in an ever-evolving digital landscape.


