
In almost every large organization, the story is familiar: too many applications, overlapping capabilities, and a run-cost line that creeps up every year. Teams add tools faster than they retire them. “Temporary” solutions quietly become permanent.
Application Portfolio Management (APM) is meant to fix this, but in many places it still lives in spreadsheets and slide decks eventually leading to lots of rationalization talk, very little change.
The Sparx Systems’ APM approach uses Enterprise Architect (EA) as the system of record for applications, and Prolaborate dashboards to expose that data through role-based views and dynamic charts. The Sparx APM Accelerator adds a tested meta-model, Excel loaders, and ready-made dashboards such as roadmaps, TIME (Tolerate / Invest / Migrate / Eliminate) charts, and TCO heatmaps, so teams can move from “PowerPoint rationalization” to a living portfolio model in weeks.
Cut Months of Setup into Days—Start with Proven Sparx Application Portfolio Management Templates
The Strategy: Moving Beyond Spreadsheets to the TIME Model
Across industries, portfolios end up fragmented for the same basic reasons caused by local decisions, project-driven tool choices, and ‘temporary’ solutions that never retire which is exactly where a structured APM approach and the TIME model help. Spreadsheets are fine for a first inventory, but they break down when you need explainable decisions:
- They don’t capture relationships (apps ↔ capabilities ↔ projects ↔ data).
- Every stakeholder ends up with their own copy and their own filters.
- There’s no single, governed way to score “business fit” or “technical completeness.”
Once you’ve seen why Sparx EA and Prolaborate work better than spreadsheets for APM, it’s hard to go back to disconnected files.

Application portfolio management dashboard in Sparx Prolaborate showing high-level KPIs, an application lifecycle roadmap, and a TIME analysis bubble chart for enterprise applications.
The Sparx APM Accelerator is designed to bridge that gap and sits on top of a structured application rationalization methodology. It gives you:
- A focused APM meta-model (applications, services, domains, stakeholders, projects, etc.), simplified and extended with the metadata APM actually needs.
- MDG profiles and validation rules so users see a clean toolbox instead of dozens of theoretical connector types.
- Excel templates and Office integration to import existing spreadsheets into Sparx EA as typed elements with all their tags.
- Model add-ins that auto-generate common diagrams (integration diagrams, landscapes, roadmaps) from the repository.
On top of that model, Prolaborate delivers the TIME view many executives now expect: a bubble chart for application rationalization that plots each application by business/functional fit and technical fit/completeness, classifying them into Tolerate, Invest, Migrate, and Eliminate.
Because the chart is fed directly from the Sparx EA APM repository, changing a score in a form or importing updated data will immediately move an application in the TIME quadrant and in any related TCO or roadmap views. You’re no longer arguing over whose spreadsheet is right because you are pointing at the same live portfolio.
Real-World TIME in Action – Cross-Industry Mini Case Studies
Once the basic APM structures are in place, the interesting work begins: using TIME classifications to remove redundancy and unlock budget. Here’s how that has played out in different organizations.
Healthcare – Reducing Redundant Clinical and Administrative Systems
A large US federal healthcare agency responsible for nationwide health programmes faces exactly this challenge. It manages billions in spend and relies on hundreds of systems, but its Sparx EA practice was spread across divisions and tools.
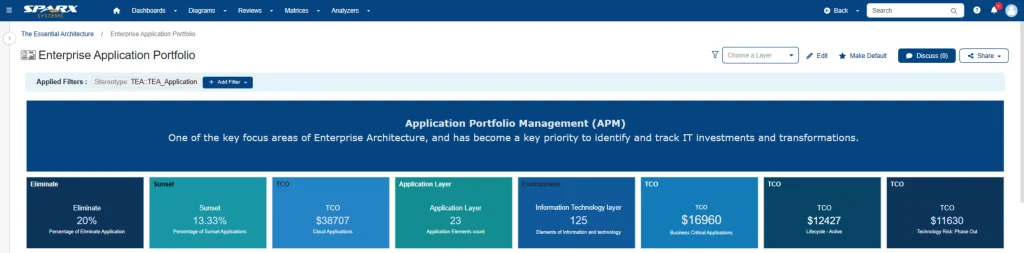
Application portfolio management dashboard in Sparx Prolaborate showing eliminate and sunset percentages, application counts, and TCO metrics for an enterprise application landscape.
They consolidated their architecture into a central Sparx EA APM repository and combined three data sources:
- Project engagements and process models.
- An annual “system census” of all IT systems.
- Integrations with third-party tools and security/governance systems via an API layer.
That data fed Prolaborate APM dashboards for capital planning and governance: system inventories, TCO charts, risk views, and TIME-style analytics that showed technical health versus business value. Decision boards could see, in one place, which systems were delivering high value and which were expensive, low-fit candidates for elimination or migration.
The result was not just nicer reports; the agency reduced its annual tooling and contractor costs by just over USD 1 million while simplifying its platform landscape.
Telecommunications – Cleaning Up BSS/OSS After Mergers
In telecommunications, redundancy often comes from acquisition. A typical operator might inherit multiple billing systems, CRMs, mediation platforms, and assurance tools from each acquired business.
In Sparx EA, the architecture team can:
- Model BSS/OSS applications as components, linked to customer journeys and revenue-critical capabilities.
- Tag each application with cost, lifecycle, vendor, hosting, and fitness scores using the APM meta-model.
- Visualize overlapping support for key capabilities (e.g., “Consumer Billing”, “Wholesale Settlements”) using landscapes grouped by domain.

Gartner TIME analysis bubble chart in Sparx Prolaborate showing enterprise applications plotted by business and technical fit to support BSS and OSS rationalization after mergers.
Prolaborate TIME charts then highlight, for example:
- Strategic billing and CRM platforms in Invest.
- Legacy mediation sitting in Migrate as new, consolidated platforms are rolled out.
- Small regional or product-specific tools in Eliminate, especially where they duplicate central capabilities and carry high integration or support cost.
Because these views are live, programme managers can track how the portfolio shifts as 5G and digital initiatives progress, and finance teams can see how retiring local tools frees budget for strategic platforms.
Internal IT – Streamlining Collaboration and DevOps Toolchains
Corporate IT is another hot spot for hidden redundancy: multiple chat tools, overlapping CI/CD pipelines, duplicate test-management SaaS, and so on.
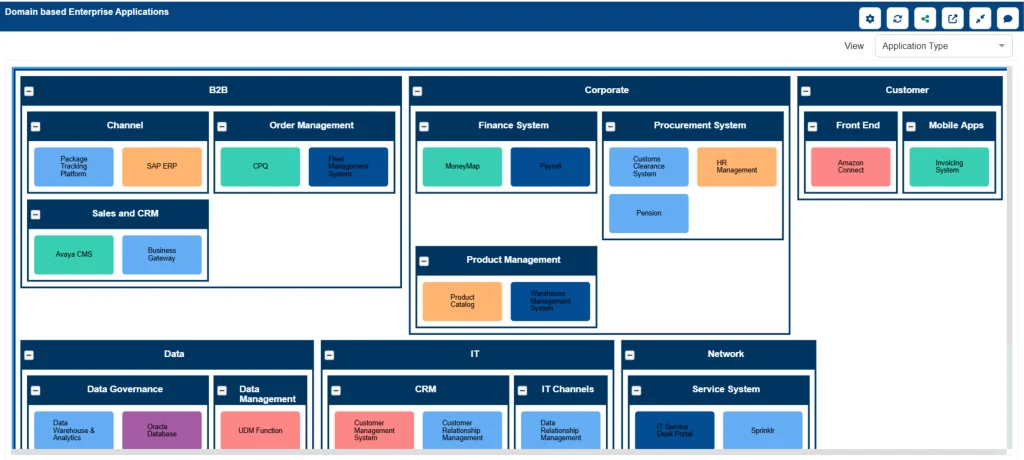
Domain-based enterprise applications view in Sparx Prolaborate showing internal IT, data, network, and customer-facing systems grouped by business domain to support toolchain rationalization.
Using the APM Accelerator, an internal IT team can quickly load an inventory of collaboration, DevOps, and testing tools from spreadsheets into Sparx EA, with attributes like:
- Owning team / business unit
- Cost and license type
- Technical stack and hosting
- Adoption level and usage metrics
Prolaborate then exposes:
- TCO charts by domain (“How much do we spend on DevOps tooling?”).
- Landscapes showing which teams use which tools, colored by lifecycle.
- TIME quadrants where niche, under-used tools naturally fall into Eliminate, and one or two strategic pipelines rise into Invest.
Instead of mandating standards by policy alone, IT leadership can show concrete evidence: “Here are the four CI/CD tools we run today, their costs, and which ones actually support critical products.” That makes it easier to rationalize and to onboard new teams into a simpler, supported stack.
Get a guided walkthrough of Enterprise Architect + Prolaborate dashboards, and visualization use cases tailored to your application portfolio and priorities.
Lessons Learned and a Practical Starting Point
Across these examples, a few patterns repeat:
- Data first, not diagrams first. Successful teams start by agreeing on the APM meta-model and attributes (cost, fit, lifecycle, risk) and getting that data into EA – often via Excel imports or existing system inventories – before worrying about pretty diagrams.
- One governed repository, many views. Sparx EA plus Prolaborate gives architects rich modeling capabilities and stakeholders simple dashboards and forms, all from the same database. That’s how healthcare governance boards, and IT leaders can all talk about the same facts from different angles.
- Clear TIME rules and role-based updates. TIME only works if everyone understands what “Invest”, “Migrate”, “Tolerate”, and “Eliminate” mean in your context, and if you’ve designed clear APM scoring models for application owners, PMs, and architects without dealing with unnecessary complexity. The APM Accelerator helps by standardizing attributes, scoring patterns, and Prolaborate forms so charts stay trusted and current.
If you can’t list your top ten “Eliminate” candidates today with a clear story about why, you don’t really have rationalization, you just have opinions. A Sparx-based APM setup gives you the structure, data, and visuals to change that, one quadrant at a time.


