
The Traceability Challenge in Software Delivery
In large software organizations, “assets” aren’t just servers or licenses. They are business applications, shared services, APIs, microservices, environments, and the CI/CD and ITSM workflows around them.
This case involves a global software provider with hundreds of applications across multiple platforms and a mix of on‑prem, cloud, and SaaS systems. Information about those systems lived in Jira, ServiceNow, ALM tools, deployment pipelines, and Excel. Different teams owned different slices of the truth, so basic questions were surprisingly hard to answer:
- If we change or retire this application, which services, customers, and environments are affected?
- Are our architecture diagrams and “as‑deployed” views accurate enough for the next engineering or compliance review?
- Where do we have redundant applications or overlapping capabilities?
To address this, they adopted the Sparx Systems Enterprise Architect, Pro Cloud Server, the APM Accelerator, and Prolaborate to create a governed, integration‑friendly model for software traceability and portfolio decisions, building on application portfolio management (APM) fundamentals and how the Sparx Systems APM platform works end-to-end.
Deploy a standardized APM framework instantly using our industry-proven metamodels and pre-configured patterns.
Sparx EA as the Single Source of Truth

Centralized application portfolio view in Sparx EA, displaying connected systems and color-coded data flows to illustrate how integrations are managed in a single model.
The Sparx EA APM model repository became the single source of architectural truth where applications, services, domains, capabilities, and change initiatives were tied together in one governed metamodel. This started with a push to build a governed application inventory in Sparx EA.
Pro Cloud Server as the Integration Layer
Pro Cloud Server sat between EA and the rest of the tooling landscape. It exposed the repository via secure APIs and integrations so that records from external tools could be represented in EA as linked items rather than duplicated masters. For example:
- Jira / ALM – Epics and features linked to the applications and capabilities they implement
- ServiceNow / ITSM – Configuration items (CIs), incidents, and changes associated with applications and services
- PPM tools – Programs and projects mapped to the applications they impact
In Sparx Enterprise Architect these items appeared with identifiers and key metadata, while the authoritative data remained in the source tools. The model accumulated the information needed for traceability and impact analysis without breaking system‑of‑record boundaries while integrating the EA APM data with external applications.
Connecting Requirements, CIs, and Projects
Using the APM Metamodel based on The Essential Architecture (TEA) patterns, the team configured EA to capture core portfolio concepts consistently:
- Applications & Services with attributes such as lifecycle outlook, business criticality, hosting type, and owning unit
- Domains and Sub‑domains grouping applications into areas like Customer Experience, Billing, Identity & Access, and Data Platform
- Application Services / Microservices – the finer‑grained services applications provide or consume
- Organizations and Owners – who owns and uses each application
- Projects and Programs – initiatives mapped to the applications and services they change
The APM Excel template and TEA import profiles pulled the initial catalogue of organizations, domains, applications, and integrations directly into EA via MDG Office integration. Once imported, the team linked in requirements and backlog items from Jira/ALM, configuration items and incidents from ITSM, and projects and releases from PPM tools. From that point on, any stakeholder could start from a CI, a Jira epic, an application, or a domain and still walk the same underlying architecture graph.
Automating Views for Engineering Review Support
With the metamodel and integrations in place, scale became the issue. Manually drawing diagrams for every application and integration in a 300‑plus portfolio would never keep up with change, so the team leaned on the APM Model Add‑in that comes with the Accelerator.
Automated Integration Diagrams
Application‑to‑application integration data from the APM Excel sheet was imported into EA. The APM Model Add‑in are leveraged to Create Integration Diagrams then generate a consistent set of views:

Example of an APM integration diagram where business applications are linked by multiple interface paths, imported from the APM Excel template.
- One Integration View per application
- Provided and consumed services, interfaces, and dependent applications shown on each diagram
- Standardized legends for interface type, criticality, and status
When integration data changed – a new dependency, a retired service, a new API – they simply re‑ran the add‑in. Diagrams updated automatically, which made it realistic to keep views current for design, integration, go‑live reviews, and post‑incident analysis.
Finding Gaps and Overlaps with Relationship Matrices
Diagrams answered “what talks to what”, but the team also needed to assess coverage and overlap. They configured Sparx EA’s Relationship Matrix against the APM Metamodel to create 2D views, such as:
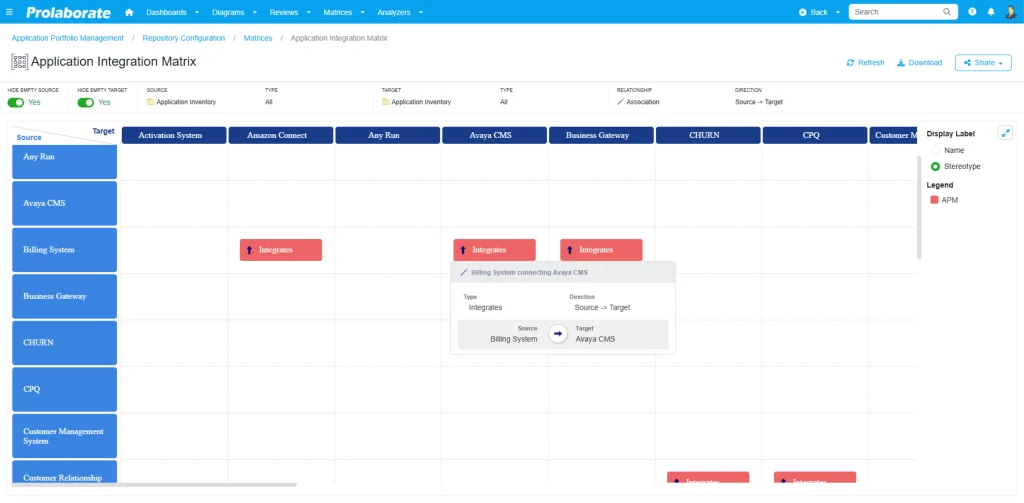
Prolaborate relationship matrix view of the application portfolio, used to visualize which systems integrate and to spot empty cells where connections are missing.
- Capabilities × Applications – to see which capabilities had no supporting applications, or too many
- Applications × Projects – to highlight systems under heavy change and those untouched by any roadmap
- Applications × Environments – to confirm where critical services were deployed and where gaps existed
Combined with APM attributes (lifecycle stage, criticality, hosting, data classification), these matrices supported rationalization and roadmap decisions across the portfolio.
Conducting What‑If and Impact Analysis in the Browser
Once the APM model was in place, Prolaborate turned it into browser‑based dashboards and reports for architects, product owners, and leadership.

Interactive impact analysis graph in Prolaborate showing capabilities, applications, domains, and projects linked by dependency lines
Using the APM Prolaborate dashboards that come along with the Accelerator as a starting point, the organization imported a ready‑made set of charts and widgets and then tailored them to their own domains and scoring to effectively build APM dashboards in Prolaborate for different stakeholders.
Typical impact analysis flows looked like this:
- Start from an Application – A stakeholder opens an application card and sees key attributes, its TIME or rationalization category, lifecycle outlook, cost or TCO metrics, and associated business capabilities.
- Follow the Dependencies – One click takes them to the auto‑generated Integration Diagram, showing which services, APIs, and dependent applications will be affected by a change or decommissioning.
- See the Change Context – Prolaborate relationships and EA matrices reveal which projects, releases, Jira epics, and environments are connected, helping review boards understand the blast radius before approving a change.
Because dashboards are driven directly from the governed EA model and refreshed via APM workflows, the views stay aligned with reality rather than diverging into stale slide decks and spreadsheets. From a compliance and audit perspective, the organization gained end‑to‑end traceability from business capability and requirement through implementation, deployment, and into production incidents and changes.
Our Experts can help jumpstart your APM with well-defined decision-grade metrics, aligned governance and role-based dashboards.
By combining Enterprise Architect, Pro Cloud Server, the APM Accelerator, and Prolaborate, this software organization turned a fragmented tooling landscape into a coherent, navigable, and auditable view of its software assets.
- Enterprise Architect, configured with the APM Metamodel, became the central catalogue and relationship model for applications, services, domains, and projects.
- Pro Cloud Server and integrations ensured that requirements, incidents, and changes from tools like Jira and ITSM platforms were linked into that model without replacing the original systems.
- The APM Model Add‑in automated integration views, keeping diagrams in sync with the portfolio.
- Prolaborate and its APM dashboards turned all of this into web‑based dashboards and reports that non‑modelers could use.
The result was a practical way to manage complex software traceability, support engineering and architecture reviews, and make portfolio decisions with a single, shared view of how applications, services, and changes are connected.


