
Application Portfolio Management (APM) must drive strategy; it involves more than just Building an application inventory in Sparx EA. Without the right applicationportfoliomanagementKPIs for cost, risk, and alignment, IT leaders fly blind. EffectiveAPMKPIshelpyou answer critical questions like:
- Where is our portfolio helping or blocking business goals?
- How much are we spending to run what we have vs changing it?
- Where are we exposed from a risk and technical debt perspective?
- Are our rationalization and modernization efforts actually moving the needle?
This is where Sparx Systems Enterprise Architect (EA) and Prolaborate shine. Sparx EA provides the structural rigor to model your portfolio, while Prolaborate transforms that data into dynamic, shareable dashboards. Together, they bridge the gap between architectural detail and executive strategy. This guide explores the essential KPIs you need to track to ensure your modernization efforts translate into measurable outcomes via Analytics, KPIs & APM decision dashboards with EA & Prolaborate.
Cut Months of Setup into Days—Start with Proven Sparx Application Portfolio Management Templates
Business KPIs (Revenue Impact, User Coverage, Business Criticality)
Shift the conversation from uptime to value. These application portfolio metrics quantify how applications generate revenue, support user operations, and impact business continuity, ensuring your portfolio directly serves organizational goals.
At a foundational level, you need to identify:
- Which applications are revenue-critical or customer-facing.
- How many users, regions, or channels depend on each application.
- Which applications are business-critical (where downtime is highly visible and impactful).
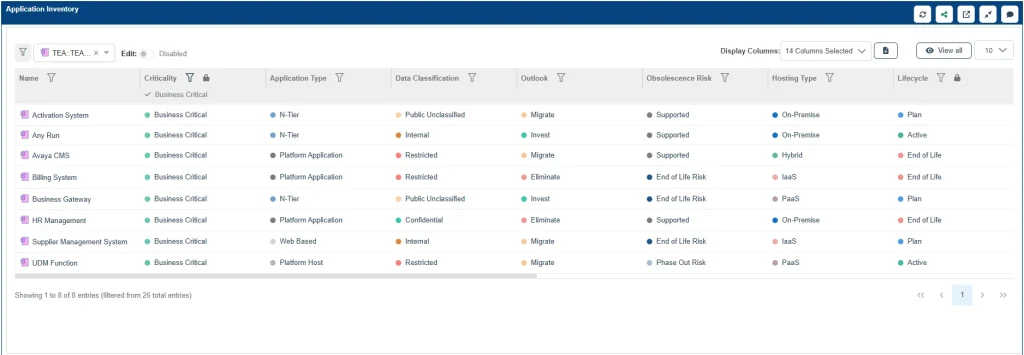
In Sparx EA, these concepts are typically captured as:
- Basic fields on the application (e.g., Criticality, Revenue Band, Main Channel).
- Links to business capabilities, processes, or products.
Capturing this data is sufficient to answer high-impact questions like, “Which critical applications are still relying on legacy platforms?”
Cost and Run/Transform Split
Move beyond basic accounting to strategic analysis. By tracking the ratio of run costs versus transformation spend, you can spot expensive legacy anchors and free up budget for innovation, which is essential for Managing Rationalization Decisions.
You do not need to push full financial data into EA. A lightweight approach is often more effective:
- Store cost bands or simple indicators (e.g., Low / Medium / High run cost).
- Add a basic field that indicates the run vs. change balance, where known.
These signals are enough for Prolaborate dashboards to highlight cost hotspots without turning EA into a complex finance system.
Risk and Technical Debt KPIs
Identify fragility before it causes failure. Specific technical debt KPIs highlight exposure from end-of-life technology, security gaps, and accumulated complexity, enabling you to prioritize remediation where business risk is highest.
You should focus on:
- Applications running on EOL (End of Life) or unsupported technologies.
- Applications with known security, compliance, or audit issues.
- Areas with poor technical health or accumulated complexity.
In Sparx EA, this usually appears as:
- A small set of risk-related fields on applications (e.g., Risk Level, Tech Risk Flag).
- Links from applications to Technology elements, Risk records, or architectural standards.
Start simply—gather just enough information to identify applications that combine high business importance with high risk or poor health, a key step in Designing APM Scoring Models.

Data Sources for KPIs (CMDB, Finance, Sparx EA Model)
Enterprise Architect (Sparx EA) is the structural hub, not the sole source. To build a complete picture, integrate architectural definitions from Sparx EA with operational stats from ITSM and financial data from ITFM tools.
High-Level Data Flow:
- EA provides structure and relationships: Applications, capabilities, processes, technologies, integrations, and scores.
- CMDB / ITSM tools provide operational signals: Environments, incident trends, and change activity.
- Finance / ITFM tools provide cost signals: Run spend, license fees, infrastructure costs, and project budgets.
You do not need full real-time synchronization. Often, pulling summarized values or bands into Sparx Enterprise Architect (EA) and linking to source systems by ID for deeper drill-down—is sufficient.
KPI Data Model in Sparx Enterprise Architect
Success lies in a structured metadata layer. By defining consistent tagged values and metric elements on your applications, you ensure that every dashboard is powered by standardized, queryable data.
A robust yet simple KPI data model in EA might include:
- A focused set of KPI-related Tagged Values on applications (Criticality, Cost Band, Tech Risk Level, Incident Band).
- Optional KPI or Metric elements if you require time-series tracking or granular detail.
The goal is not to model everything, but to provide dashboards with enough structured fields to drive meaningful insights.
Visualizing KPIs in Sparx Systems Prolaborate
Data only creates value when shared. Building APM Dashboards in Prolaborate allows you to transform your structured EA models into intuitive, web-based APM dashboards, letting non-technical stakeholders consume complex portfolio insights at a glance.
Effective dashboards typically combine:
- KPI Cards: Small tiles at the top of a dashboard showing counts and simple ratios (e.g., Total Apps, High-Risk Apps, Apps on EOL Tech, Apps Marked for Retirement).
- Charts: Bar or pie charts that break the portfolio down by criticality, lifecycle, hosting type, or risk level.
- Tables: Filtered lists of applications for actionable follow-up (e.g., “High Criticality + Poor Technical Health”).
Dashboards can be tailored to specific perspectives: one for business-critical apps, one for risk, one for cost, and one for rationalization.
KPI Cards and Charts: A Starting Point
A lightweight, high-impact dashboard might include:

4–6 KPI Cards:
- Total Applications
- High-Criticality Apps
- Apps on Legacy/EOL Tech
- Apps Marked for Modernization
2–3 Charts:
- Applications by Business Criticality
- Applications by Technical Health or Risk Band
- Applications by Lifecycle (Proposed / Active / Sunset / Retired)
Because these visuals are driven directly from Sparx EA, your cards and charts remain aligned with the current model, allowing you to deepen the metrics later without reworking the basics.
Turn static models into actionable insights. See firsthand how to visualize application lifecycles, costs, and risks in real-time.
Start Small, Think Big
The journey to effective Application Portfolio Management does not require a “big bang” implementation. By starting with the essential APM performance indicators like business criticality, cost patterns, and risk exposure, you can immediately begin to surface actionable insights.
The combination of Sparx EA’s robust modeling and Prolaborate’s accessible dashboards creates a powerful feedback loop. As stakeholders begin to trust the data, you can iteratively expand your model to include deeper financial integration or real-time operational metrics. The key is to start with structure, visualize the results, and let the data drive your strategic transformation.


