
When “Keeping the Lights On” Dominates the Budget
A global telecommunications provider with more than 25 million subscribers had a familiar problem: IT spend kept climbing, but very little of it felt strategic.
Around 78% of the IT budget was going into “run” keeping hundreds of OSS/BSS, CRM, billing, and network management systems alive. Application lists lived in multiple CMDBs and spreadsheets; cost and license data was scattered across finance systems and vendor portals. Nobody had a single, trusted view.
The CIO and CFO agreed on a clear mandate:
Find 20–30% savings in IT run costs, and at least 30% in licensing, without harming service quality.
To get there, the architecture team implemented Application Portfolio Management (APM) on the Sparx Systems APM Platform, using Enterprise Architect, Prolaborate, and the Sparx APM Accelerator to turn a fragmented picture into a governed, financial-grade portfolio, as part of a broader cost optimization through application rationalization agenda.
Stop guessing and start deciding. Let our experts help you align your architecture with business goals using proven governance frameworks and clear metrics.
Financial Discovery Through Application Inventory
Assembling a Financially Ready Application Catalogue
The first step was to stop debating the numbers and build a single, authoritative Application Master to effectively build an application inventory in Sparx EA that everyone could trust.
Using the APM MDG Profile and model patterns from the APM Accelerator, the team stood up an APM-specific project structure in Enterprise Architect:
- Application Layer – OSS/BSS, CRM, billing, network ops, self-care, analytics
- Business Layer – organizations, customer segments, product lines, owners
- Governance Layer – policies, lifecycle status, risk, strategic initiatives
They then used APM Excel Templates and TEA Import Profiles to pull data from regional CMDB exports, license spreadsheets and finance reports. Within a few weeks, they had thousands of applications in Sparx EA, each enriched with:
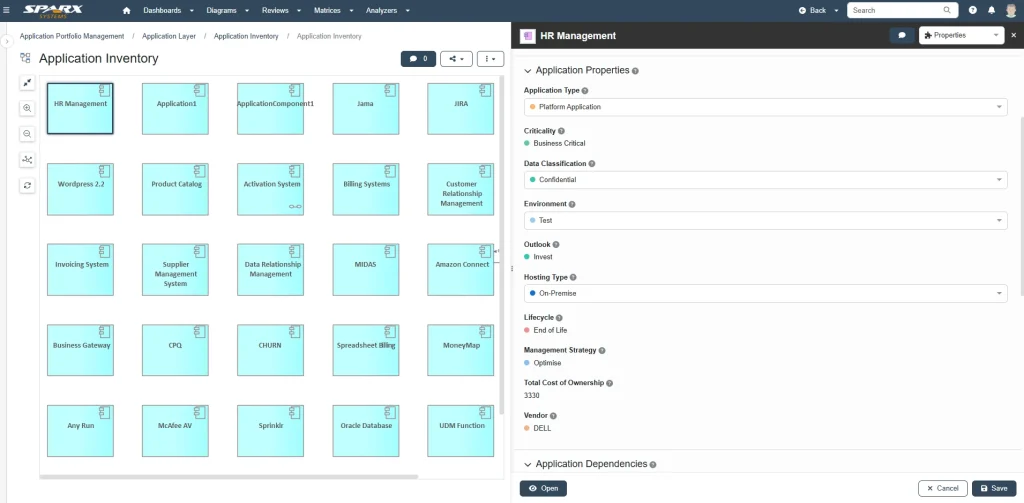
Application inventory view showing a catalog of systems with detailed properties like criticality, data classification, hosting type, lifecycle, and total cost of ownership
- Total Cost of Operations (TCO: licenses, infra, support)
- Lifecycle dates
- Criticality (customer-impacting vs internal)
- Hosting Type (on-prem DC, telco cloud, public cloud, SaaS)
- Data Classification (customer PII, network data, internal only)
- Owner and consuming business units
For the first time, network operations, IT and finance were looking at the same catalogue, backed by a shared APM metamodel instead of disconnected lists.
TCO Analysis Sliced by Custom Lenses
Once the data was in the model, the team shifted the conversation to Prolaborate dashboards. The dashboards from the Sparx APM Accelerator pack provided ready-made views over their real data, very similar to how you would build APM dashboards in Prolaborate for other portfolios.
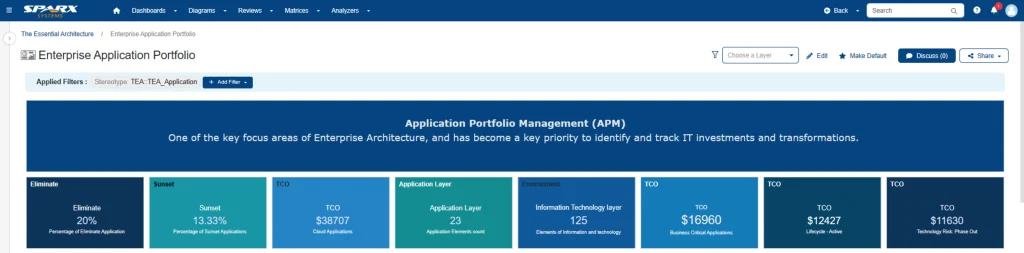
Application portfolio management dashboard in Sparx Prolaborate with card widgets summarizing TCO, application counts and lifecycle categories such as eliminate and sunset.
They could now:
- View TCO by domain (Billing, CRM, Network Operations, Digital Channels, Field Services).
- Slice spend by Hosting Type, comparing on-prem vs telco cloud vs SaaS.
- Filter by data sensitivity to see where high-risk data drove high costs.
- Drill into specific regions or business units to see who owned which systems and why.
One early insight changed the tone of discussions:
- Just three domains namely, Billing, CRM and Network Operations are accounted for nearly 60% of application TCO.
- In Billing alone, they discovered 14 systems contributing to rating, invoicing, payment and dunning across regions.
The dashboards turned suspicion (“We must be overspending somewhere”) into evidence. Leaders could see exactly where money was going, and which clusters of applications were clearly overcrowded.
Driving Rationalization Decisions
Applying TIME to Telecom Reality
With visibility in place, the team moved on to deciding what to do with each application. They adopted the Gartner TIME (Tolerate, Invest, Migrate, Eliminate) framework and embedded it directly in the Sparx EA APM model and Prolaborate views.
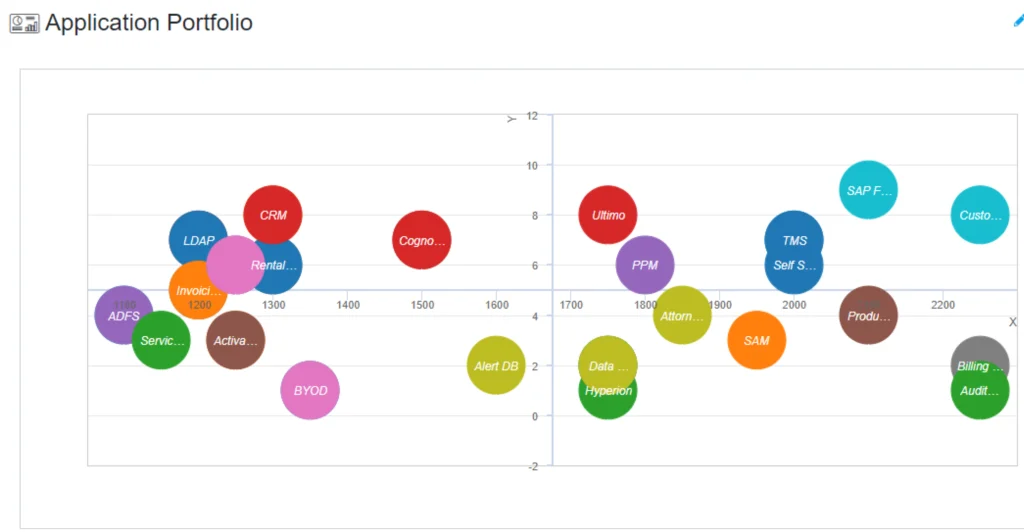
Bubble chart of the application portfolio plotting systems as colored circles by business and technology fitness to support TIME-based rationalization decisions.
For major applications, they assessed each one using an APM scoring model for cost, risk, business value and technical health:
- Business Fitness – Fit to current and future product and customer strategy
- Technology Fitness – Platform currency, cloud readiness, technical debt
- Risk – Security, data privacy, operational fragility
- Cost – Run and license costs, plus significant workarounds
These attributes were captured as properties and assessments in EA, then exposed through TIME dashboards.
Patterns emerged quickly:
- A legacy prepaid billing platform in two smaller markets was costly, on unsupported hardware, and duplicated the converged billing system → Eliminate.
- A heavily customized on-prem CRM for enterprise sales was functionally rich but brittle; a global SaaS CRM rollout was in flight → Migrate.
- A modern, cloud-native self-care app integrated with 5G use cases was strategic and efficient → Invest.
- Several niche internal reporting tools with low TCO and acceptable risk were marked Tolerate until analytics consolidation.
TIME, implemented in dashboards, gave executives an at-a-glance view of how much TCO sat in Eliminate/Migrate vs Invest/Tolerate, and how that balance shifted quarter by quarter.
Identifying Redundancy via Domain Alignment
The other breakthrough came from aligning applications to a telecom domain hierarchy configured in the APM metamodel – Customer Management, Billing & Revenue Management, Network Operations & Assurance, Field Services, Digital Channels and Enterprise Services.
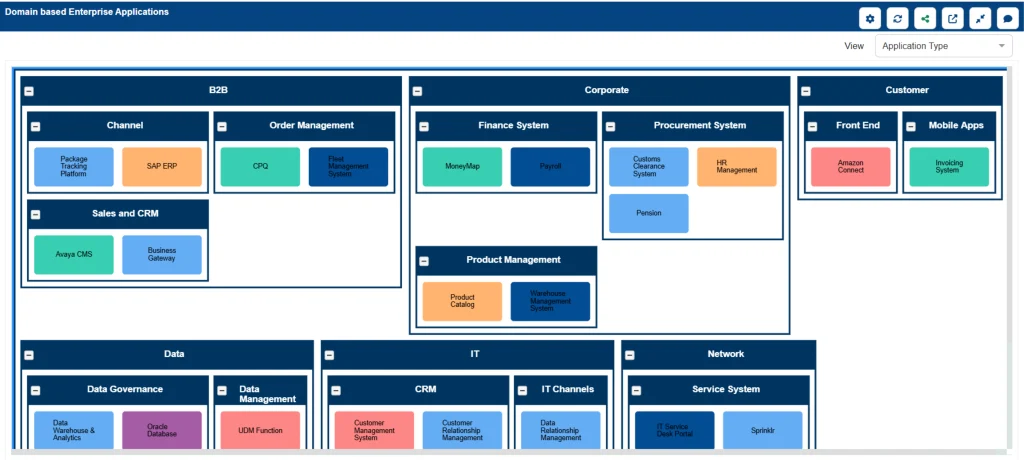
Application portfolio from Sparx APM model grouped by enterprise domains such as B2B, corporate, customer, data, IT and network, illustrating how different systems support each function.
By mapping each application to domains and sub-domains in EA and surfacing this through domain-based dashboards and reports, they could:
- Spot three separate field-force scheduling tools used by different regions for essentially the same work.
- See overlapping network trouble-ticketing systems inherited from past acquisitions.
- Identify multiple self-carefront-ends driving extra license fees and integration overhead.
Using integration diagrams generated from the imported integration sheet, they also saw where retiring a system would impact network data flows, billing pipelines or customer channels. Rationalization plans were not just about cost, instead they were grounded in dependency-aware change.
Within six months, the team had a prioritized backlog of rationalization candidates, each with a TIME category, estimated TCO and license impact, affected domains and integrations, and a proposed roadmap position.
Tracking Savings and Transformation Progress
Visualizing Change with Advanced Roadmaps
The final step was turning decisions into an executable, trackable transformation. Using Advanced Road mapping in the Sparx Architecture Platform, the team built portfolios of:
- Application Roadmaps – showing when systems would be consolidated, migrated or retired.
- Program Roadmaps – aligning application changes with initiatives like 5G rollout, BSS modernization and digital channel upgrades.
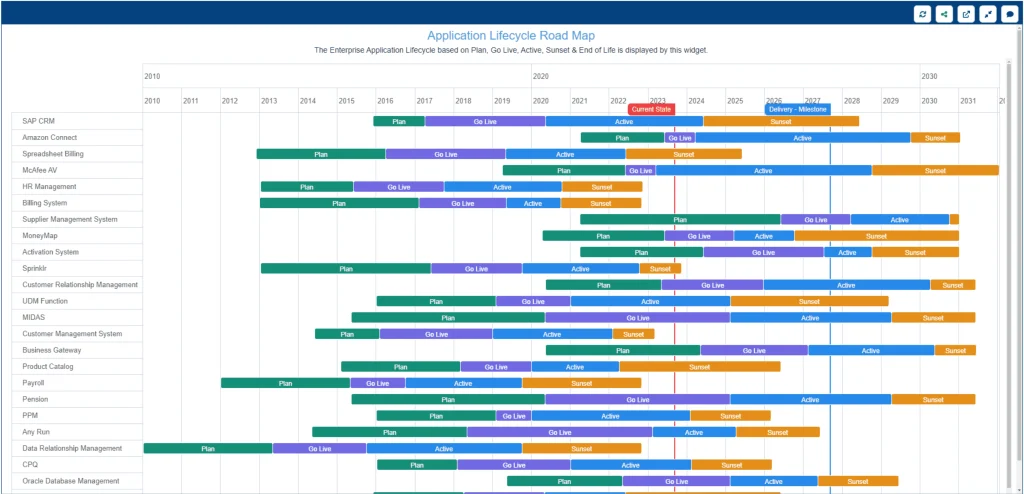
Application lifecycle roadmap chart in Prolaborate showing multiple systems plotted over time with plan, go-live, active, sunset and end-of-life phases.
These were model-driven visualizations, where each bar represented a real application or project element in the Sparx EA repository. This provided a concrete example of using lifecycle roadmaps to track application evolution rather than relying on static slide decks. Stakeholders could:
- Filter by TIME category to see when Eliminate and Migrate systems would exit.
- Slice by Criticality, Data Classification or Hosting Type to check that high-risk, high-cost systems were addressed early.
- Overlay TCO trends to show expected savings as key milestones were reached.
Over an 18–24 month horizon, the telco achieved:
- 22% reduction in IT run costs related to applications (infrastructure + support).
- 30% reduction in license spend, primarily by:
- Consolidating billing platforms in two regions
- Standardizing on a single CRM stack
- Retiring a long tail of niche and redundant tools
- A much simpler board narrative: a clear line of sight from strategic programs to concrete cost and risk outcomes.
Sparx APM Accelerator as the Catalyst for Smart Telecom IT Spend
For this telecom operator, the real win wasn’t just the 30% license savings. It was the ability to explain, with evidence, where the money was going and why specific changes made sense.
By implementing Application Portfolio Management on the Sparx Systems Architecture Platform using Enterprise Architect, Prolaborate and the APM Accelerator, they:
- Built a governed application inventory with TCO, risk and lifecycle data that finance could trust.
- Used Prolaborate dashboards to analyze TCO through telecom-relevant lenses – domains, hosting, risk and geography.
- Applied the Gartner TIME framework and domain alignment to identify concrete rationalization and consolidation opportunities.
- Used Advanced Roadmapping to sequence those changes over time and show that planned savings were being realized.
Turn static models into actionable insights. See firsthand how to visualize application lifecycles, costs, and risks in real-time with the Sparx Systems APM Platform.
In a sector where customer expectations are unforgiving and technology shifts are constant, APM became the bridge between architecture insight and hard financial outcomes.
Instead of arguing over spreadsheets, the CIO and CFO now share a single, model-backed view of the application landscape and a clear, defensible story about how they freed up nearly a third of their license budget to invest in the next generation of network and digital services.


