
Why APM Dashboards Matter in Large Organizations
In large organizations, application portfolios are huge, budgets are tight, and expectations from business and technology leaders keep rising. APM dashboards for smarter application portfolio management are where those worlds meet: they translate complex application, cost, and risk data into something CIOs, architects, and business owners can act on together.
When dashboards are designed well, they become the front door into your APM practice. CIOs can see where money and risk are concentrated, architects can understand complexity and dependencies, and business stakeholders can see how applications support their outcomes—all from the same underlying model.
This is where Sparx Systems comes in. Sparx Enterprise Architect and Prolaborate together provide an integrated APM platform with modeling and dashboards in one place. Sparx EA hosts the central APM model with applications, capabilities, processes, data, technology, projects, and risk, while Prolaborate turns that model into live, role-based dashboards. Instead of exporting data into disconnected slide decks and spreadsheets, stakeholders can work from a shared, always-current view of the portfolio.
Role-based dashboards then build on this foundation. By tailoring views for CIOs, architects, business owners, and security teams, you move from “APM as documentation” to “APM as a decision-support platform” that people actually use.
Our Experts can help jumpstart your APM with well-defined decision-grade metrics, aligned governance and role-based dashboards.
Why Role-Based APM Dashboards Matter
Different stakeholders look at the same application portfolio but care about very different things:
- CIO / IT leadership – spend, risk, and rationalization progress.
- Enterprise and solution architects – integration hotspots, technical debt, and traceability.
- Business and product owners – which apps enable or block specific outcomes.
- Security and compliance – where sensitive data sits and how exposed those systems are.
If all of them log into Prolaborate and see the same generic inventory charts, they will not come back. They will revert to email and slide decks, and your APM initiative turns into a static catalog. Creating stakeholder-specific APM views ensures each group sees the portfolio in its own perspective while still drawing from a single source of truth
Role-based dashboards fix this by:
- Starting with decisions – Each dashboard focuses on a small set of questions that role needs to answer.
- Sharing one model – Every view is driven from the same Sparx EA APM repository, so there is one source of truth, just different slices.
- Reducing friction – Stakeholders can scan and drill into what matters in a couple of clicks, without learning EA as a modeling tool.
To make these views truly actionable, you also need to define the right KPIs for application portfolio management so each dashboard highlights the metrics that drive decisions. Together, Sparx EA and Prolaborate become a portfolio decision-support platform rather than just another reporting tool.
How Sparx EA and Prolaborate Enable Role-Based Dashboards
Sparx EA as the APM Source of Truth
Sparx Enterprise Architect provides the backbone: an APM metamodel that connects:
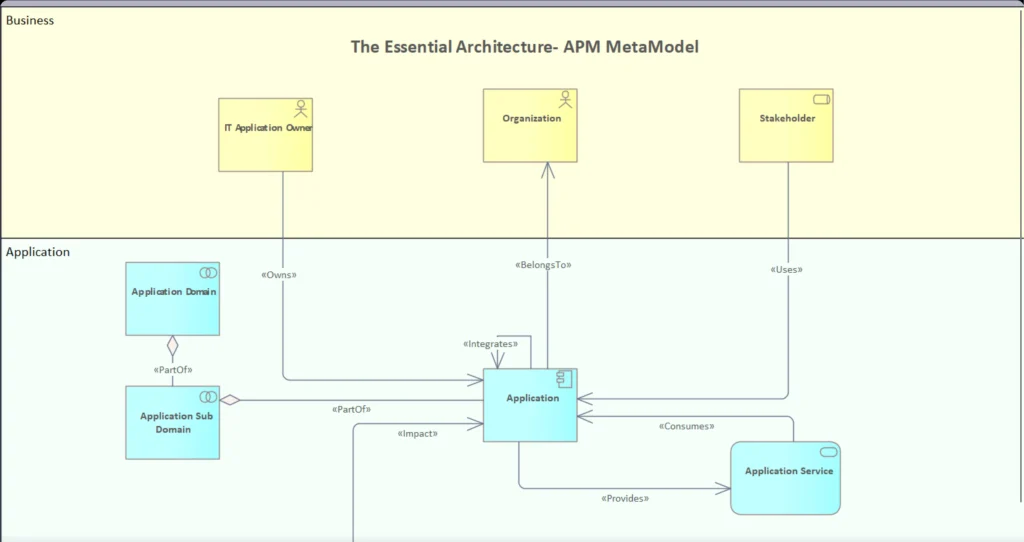
Application portfolio metamodel diagram in Sparx EA showing relationships between business owners, organizations, stakeholders and application domains, applications and services across business and application layers
- Applications with lifecycle, cost, ownership, and technical attributes.
- Business capabilities, processes, and services they support.
- Data and integrations that carry sensitive information or operational risk.
- Technology components and hosting (on-prem, cloud, SaaS) with vendor and end-of-support details.
- Projects and initiatives changing the portfolio in the next 1–5 years.
- Risk and fitness scores such as business fit, technical fit, security posture, TCO, and TIME category.
Whether you use the Sparx APM Accelerator or your own ArchiMate-based metamodel, Sparx EA acts as a single, connected model to drive dashboards.
Prolaborate as the Role-Based Delivery Layer
Prolaborate turns that model into targeted, self-service views:

Enterprise application portfolio dashboard in Prolaborate showing APM KPIs, application lifecycle roadmap timeline and TIME analysis bubble chart for rationalization decisions
- Role-based home dashboards – CIO, architecture, business, and security groups land on different dashboards when they log in.
- Visualization widgets – charts, matrices, heatmaps, landscapes, and KPI cards, all driven by live EA data.
- Inventory and table views – filterable grids where each role sees only the columns that matter to them.
- Navigation tiles and deep links – quick jumps into diagrams or drill-down lists such as “Apps with confidential data on end-of-support tech.”
- Fine-grained permissions – control which packages, elements, or fields each group can see or edit.
You do not copy data for each audience; you configure forms, columns, filters, and dashboards as different windows on the same APM model. An Application Manager might focus on environment, vendor, and lifecycle, while a Program Manager sees projects, milestones, and capabilities by referring to the same application elements in Sparx EA.
Once the model is in place, you can build APM dashboards in Prolaborate using these widgets and views, tailoring each dashboard to the needs of a specific role.
Cross-Industry Mini Case Studies – Role-Based Dashboards in Action
Healthcare Agency – CIO, Clinical Leadership, and Architecture on the Same Page
A national healthcare agency runs hundreds of clinical and administrative applications: EHR, claims, billing, patient engagement, provider management, analytics, and more. Historically, architecture lived in its own toolset and leadership relied on ad hoc spreadsheets for capital planning and system census exercises.

Prolaborate APM dashboard with KPI cards summarizing eliminate and sunset candidates, total cost of ownership and application counts for executive portfolio review
They implemented Sparx EA as the central repository for business processes, applications, integrations, and technology, and used Prolaborate to publish dashboards into their cloud environment. Data from a yearly “system census” and other sources flows in through APIs and is visualized in near real time.
Role-based dashboards
- CIO view – Cost by capability (care delivery, member services, billing, regulatory reporting), rationalization status (keep, consolidate, retire), and a risk/obsolescence heatmap that highlights high-cost systems running on end-of-support technology.
- Clinical leadership view – End-to-end clinical workflows mapped to supporting applications, with overlays for known issues, planned outages, and upcoming change windows.
- Architecture view – Integration hotspots (high fan-in/fan-out interfaces), technology stacks approaching end-of-support, and coverage of data models and standards across systems.
Outcome
- Steering meetings stopped demanding PowerPoint presentations; leaders now review live Prolaborate APM dashboards and drill into details as needed.
- Clinical leaders can see without technical jargon where changes in the application portfolio will touch their workflows.
- Architects spend less time as “report generators” and more time on analysis and design, because the dashboards are fed directly from their Sparx EA APM repository.
Defense Organization – Program Managers, Security, and Architects Sharing One Picture
A defense organization runs multiple programs, each with its own systems, integrations, and security constraints. The portfolio spans command-and-control, logistics, training, and intelligence systems, all subject to strict security and accreditation requirements.

Icon-based Prolaborate dashboard showing mission and digital tiles for concepts, operations, equipment, applications, roles and requirements to guide role-based architecture views
Previously, each program kept its own spreadsheets and Visio diagrams. Security teams saw lists of vulnerabilities and CVEs, but it was hard to relate them to mission impact. Program boards saw projects and milestones, but not the underlying technical risk.
Role-based dashboards
- Program managers – Capabilities mapped to supporting systems, with readiness scores, risk ratings, and roadmap milestones. They can immediately see which systems underpin high-priority missions and when major changes hit.
- Security teams – Views of systems handling sensitive information, annotated with data classification, hosting type, open vulnerabilities, and end-of-support technology, all filtered by mission or program.
- Architects – Traceability coverage from requirements through systems to interfaces and technologies, plus metrics on integration complexity (number of interfaces per system, protocol spread, etc.).
Outcome
- Program boards now review live dashboards during governance sessions instead of static architecture artifacts.
- Security can prioritize remediation based on mission criticality instead of just raw vulnerability counts.
- Architects use the same shared dashboards to justify design decisions, decommission systems, and argue for investment in refactoring or consolidation.
In all cases, the key is that everyone is looking at different slices of the same APM model in Sparx EA.
Start your APM journey. Learn the fundamentals of portfolio setup, defining risk categories, and building your first dashboards.
From Static Models to Living APM Conversations
Role-based APM dashboards are the key to turn Sparx EA from “the architects’ modeling tool” into a portfolio-wide decision-support platform.
When CIOs can see cost, risk, and rationalization in their language, architects can drill into structure and dependencies, business owners can relate apps to outcomes, and security teams can view exposure through the same environment, you start to get real behavioral change:
- Decisions are made in front of live dashboards, not static slide decks.
- Portfolio conversations shift from “what do we have?” to “what should we change next, and why?”
- The Sparx EA APM repository becomes a living asset that stakeholders trust and use regularly.
If stakeholders are still asking you to “send the slides” before every major decision, that’s a signal: your dashboards aren’t yet truly role-based. The good news is that with a solid APM metamodel in Sparx EA and thoughtfully designed Prolaborate dashboards, you already have everything you need to fix that.


