
The Mandate for Federal IT Cost Reduction
If you work in a federal healthcare organization today, you already know the message from leadership: do more with less, and prove it with data. Budgets are flat or shrinking, yet expectations around digital services, cybersecurity, patient privacy, and regulatory compliance continue to grow.
When this large US government agency first took stock of its portfolio, it faced exactly this mandate. Their CIO had asked a simple question that was surprisingly hard to answer:
“How many applications do we actually run, what do they cost us, and where is the redundancy?”
The team had pockets of documentation in spreadsheets, SharePoint lists, and configuration tools but no governed, analysis-ready view of the application portfolio. At the same time, industry case studies had shown that effective application rationalization can unlock significant cost savings by retiring redundant and low-value applications and optimizing licenses. In this agency’s case, their APM initiative ultimately delivered over US $1 million in annual savings.
This is the story of how they used the Sparx Systems Enterprise Architect, the APM Accelerator, and Prolaborate dashboards to build that missing view, apply TIME categorization, and confidently commit to over US $1 million in savings, all within a governed APM capability.
Our Experts can help jumpstart your APM with well-defined decision-grade metrics, aligned governance and role-based dashboards.
Establishing a Governed, Analysis-Ready Inventory
Their first objective was not to build dashboards. It was to ensure that the data behind the dashboards would be trusted. That meant a governed metamodel, consistent data entry, and repeatable integration from source systems.
Configuring the Focused Metamodel
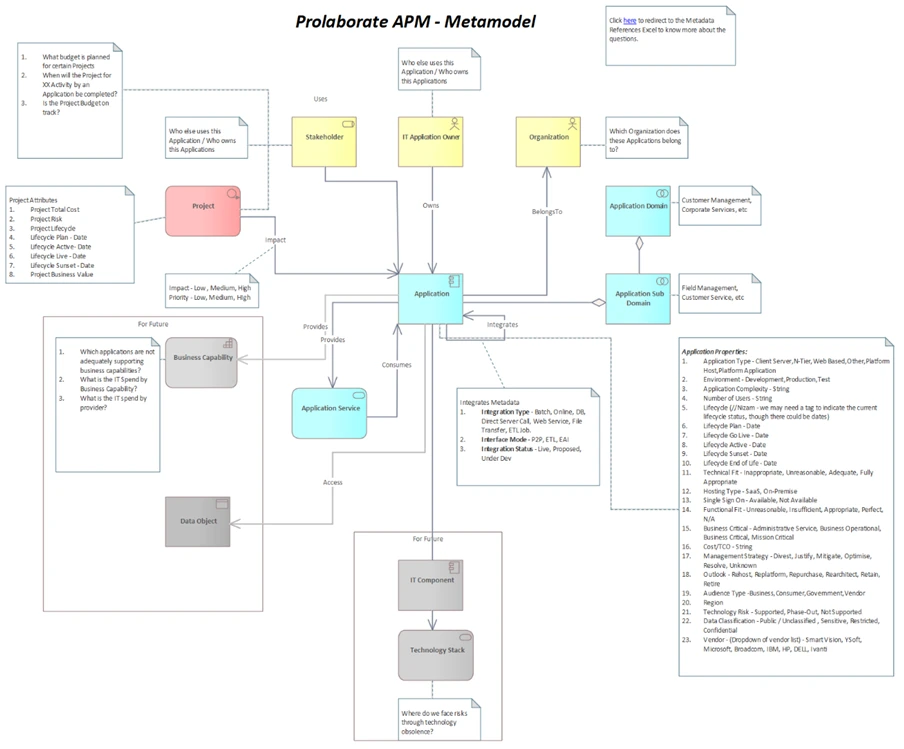
Example Application portfolio metamodel showing how Applications relate to Stakeholders, Owners, Organizations, Projects, Business Capabilities, Services, Data, and Technology stack.
Instead of starting with a blank canvas, they leveraged the Application Portfolio Management Accelerator and the underlying APM Metamodel from The Essential Architecture (TEA) framework. This gave the agency a proven starting point with:
- A well-standardized APM metamodel centered on Applications, their attributes (lifecycle, risk, TCO, data classification, hosting, etc.), and their relationships to Domains, Sub-domains, Projects, Owners, and Stakeholders.
- Customized MDG Profiles in Enterprise Architect that enforced modeling rules, constrained stereotypes, and provided APM-specific toolboxes and patterns.
- Workspace building blocks that aligned the repository to the agency’s architecture practice.
Rather than allowing every architect to create their own version of an “Application,” the architecture team defined a focused APM taxonomy and data model, business‑query‑driven metamodel:
- If they want to answer TIME questions, they capture Business Fitness, Technology Fit, risk, and TCO attributes.
- If they want to expose redundancy, they capture Domain, Sub-domain, and Application Services to see functional overlaps.
- If they want to impress finance, they align cost fields to how the agency already reports Total Cost of Operations (TCO).
The MDG Profile encapsulated these decisions so that every modeler worked against the same structure, which is critical if you want focused insights rather than inconsistent diagrams.
Importing Data Into the Sparx APM Model for Comprehensive Review
With the metamodel in place, the question became: how do we populate it quickly without manual re-typing?
Here they leaned on the assets delivered as part of the APM Accelerator:
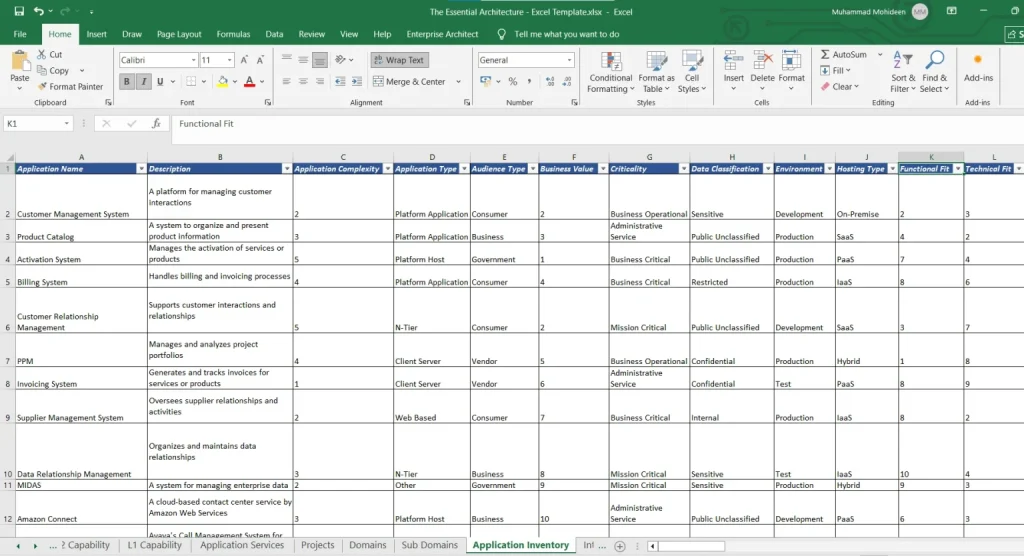
Illustration of the Application inventory Excel template listing applications with attributes like complexity, business value, criticality, data classification, hosting type, and fitness scores for APM import.
- A curated Excel Template with dedicated sheets for Organizations, Stakeholders, IT Application Owners, Domains, Sub-domains, Applications, Projects, Application Services, and Integrations.
- Import Profiles for MDG Integration for Microsoft Office, pre-mapped so that each spreadsheet column flowed into the right element, connector, or tagged value in the model.
For the agency, the architecture team adapted this template to match their existing data structures, then:
- Consolidated application lists from CMDBs, license tools, and local spreadsheets into the APM Excel Template.
- Used import profiles to load the data into Enterprise Architect, creating a governed Application Inventory in Sparx EA with all key relationships preserved.
- Established live and scheduled integrations to external IT systems using Sparx Pro Cloud Server’s RESTful APIs where appropriate, so the APM inventory would remain current over time.
After two iterations, the CIO’s office had, for the first time, a single, analysis-ready catalog of applications governed by the MDG Profile and aligned with their architecture and financial reporting needs.
Driving Decisions with Gartner TIME Analysis
Once the data foundation was stable, they turned to the question that everyone was waiting for: Which applications do we keep, which do we modernize, and which do we eliminate?
They implemented the Gartner TIME methodology (Tolerate, Invest, Migrate, Eliminate) as the primary lens for rationalization.
Prioritizing Opportunities (Tolerate, Invest, Migrate, Eliminate)
In the APM Metamodel, they configured attributes for a cost, risk, business value, and technical health scoring model:
- Business Fitness – How well the application supports current and planned capabilities.
- Technology Fit – Alignment with target architecture, maintainability, and technical obsolescence.
- Risk – Security posture, compliance gaps, and operational stability.
- Cost / TCO – Annual cost of operations, including licenses, hosting, support, and enhancement.
Using these attributes, they designed TIME Dashboards in Prolaborate:

Gartner TIME analysis bubble chart showing applications plotted by business fitness and technical fit, highlighting candidates to Tolerate, Invest, Migrate, or Eliminate.
- A quadrant chart showing Business Fitness vs. Technology Fit, with colors representing TIME categories.
- Tabular views listing applications by TIME category and domain, with filters for cost, risk, and lifecycle.
- Real-time charts that could slice TIME categorization by Department, Domain, Data Classification, or Hosting Type.
APM analysts and domain owners were invited into interactive working sessions:
- They reviewed auto‑calculated TIME recommendations based on scoring rules.
- They adjusted ratings where narrative context mattered (for example, applications that looked weak technically but were critical for a short-term mission).
- They added comments, flags, and planned actions directly in the Prolaborate dashboards.
Within a few weeks, the agency had a visually intuitive, governed TIME view of its portfolio that clearly exposed redundancy, for example, three separate case management tools supporting similar workflows for different bureaus.
Quantifying Value with Total Cost of Operations (TCO)
TIME categorization tells you what to change. Finance wants to know “how much will it save, and where does that show up in the budget?”
This is where Total Cost of Operations (TCO) became the bridge between architecture and finance.
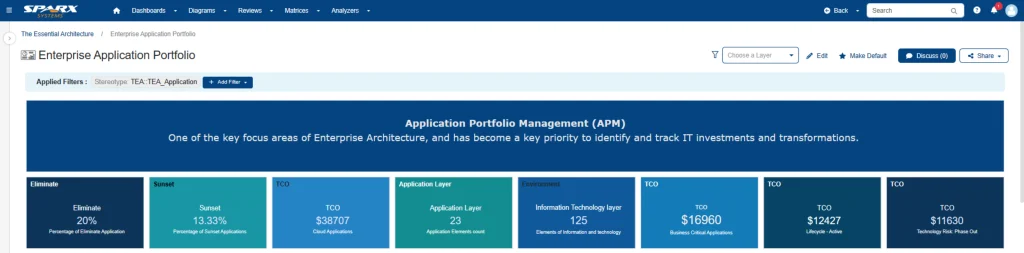
Sample APM summary dashboard showing enterprise application portfolio tiles with Eliminate and Sunset percentages, application counts, and TCO figures for different risk and lifecycle categories.
TCO Views Sliced by Custom Lenses
From the APM Features and APM Solution guidance, the team configured the model and dashboards to support multi‑lens TCO analysis:
- By Domain and Sub-domain – How much does each business area spend on applications, and where are there spikes?
- By Hosting Type – On‑prem vs. cloud, which gave input into the agency’s cloud migration plan.
- By Data Classification and Risk – High‑sensitivity applications with high TCO and high risk became high‑priority candidates for modernization.
- By TIME Category – Summed TCO for all Eliminate or Migrate candidates, which formed the headline savings number.
Prolaborate’s Application Portfolio Management (APM) dashboards exposed these as focused insights:
- Cards showing total TCO by TIME category.
- Charts breaking down cost by hosting type or domain.
- Drill‑through views where an executive could click into a bar on a chart and see the underlying applications.
When the architecture team presented the consolidated view, the CIO finally had an answer:
- Roughly 18% of the annual application TCO sat in the Eliminate quadrant.
- Another 15% was in Migrate candidates where consolidation or re‑platforming would reduce run costs.
Conservatively assuming that only a portion of Eliminate and Migrate candidates would be executed, the agency still modeled over US $1 million in annual savings, with a clear link from each dollar to a specific application decision.
Results: Elimination and Roadmapping for Savings
With the inventory governed, TIME analysis complete, and TCO quantified, the final step was to turn insight into an executable roadmap.
Tracking the Path to Application Retirement
Using the Advanced Roadmapping capabilities of the Sparx Architecture Platform and Prolaborate APM dashboards, the agency designed Application and Project Roadmaps that showed:
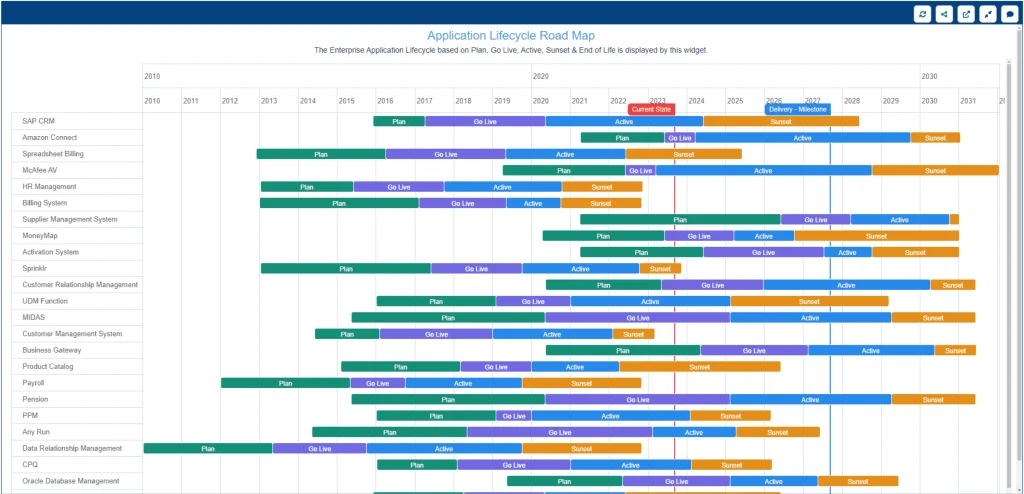
Application lifecycle roadmap showing each application on a horizontal timeline with Plan, Go Live, Active, Sunset, and End-of-Life phases across multiple years.
- When each Eliminate or Migrate candidate would be rationalized (by quarter and year).
- Which replacement or target platforms would absorb functionality.
- Dependencies on ongoing or planned projects.
- How application lifecycles intersected with contract renewals and budget cycles.
These roadmaps were not static PowerPoints. They were live views driven from the same APM model, sliced and diced in Prolaborate:
- Executives could view the roadmap by Domain, by Business Unit, or by Hosting Type.
- Architecture teams could zoom into specific integrations to understand the impact of retiring a system.
- Program managers could align project milestones with application retirement dates.
Over the following planning cycle, the agency:
- Identified and planned the retirement or consolidation of dozens of redundant or low‑value applications.
- Optimized licenses for several high‑cost platforms by aligning entitlements to actual usage.
- Reinvested a portion of the savings into modernization and cybersecurity initiatives.
The conservative outcome: a committed savings roadmap delivering over US $1 million in annual savings, backed by traceable decisions and visualized through APM dashboards that leadership could understand at a glance.
Deploy a standardized APM framework instantly using our industry-proven metamodels and pre-configured patterns.
Closing Thoughts
From an architect’s perspective, the lesson from this engagement is simple:
You don’t get a million dollars in savings by building a pretty dashboard. You get it by designing a focused APM metamodel, capturing the right data reliably, and then using interactive APM dashboards using Prolaborate to tell a story that finance and business leaders can trust.
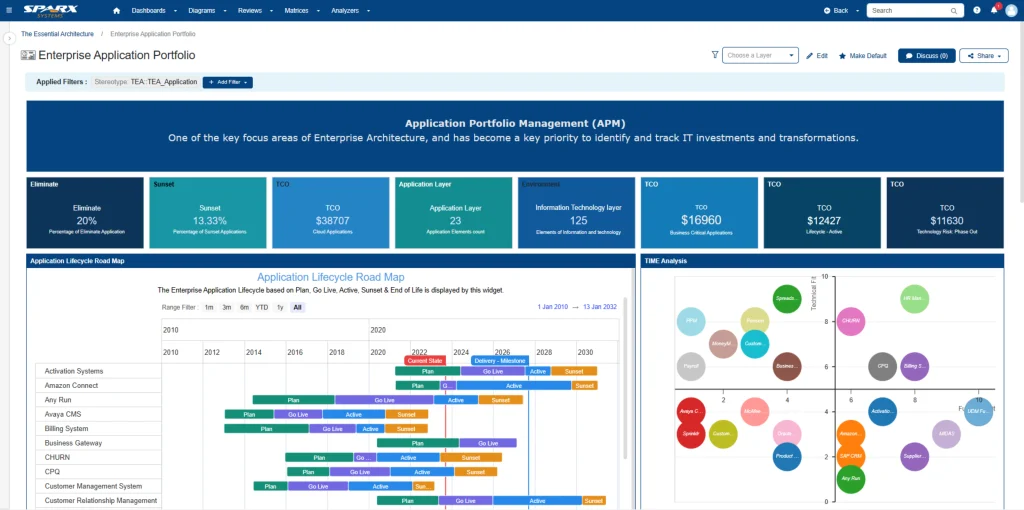
This is a sample Enterprise Application Portfolio Dashboard Combining various metrics, lifecycle roadmap, TIME analysis, rationalization priorities in one view.
The Sparx Systems APM Platform consisting of Enterprise Architect with the APM Accelerator, and Prolaborate with its pre-defined APM dashboards, gave this agency a single, governed source of truth for its application portfolio, and the ability to continuously refine its roadmap as conditions change.
For organizations under similar pressure to eliminate redundancy and prove ROI, this approach offers a practical, repeatable path: start with a strong metamodel, load the data once, and let your dashboards earn their keep.


