
“What’s the real return on investment for Application Portfolio Management (APM)?” It’s a question every business leader asks. Because APM impacts everything from costs and security risks to how fast the business can adapt. You need a model that captures the complete picture. A simple cost-cutting number isn’t sufficient.
This guide offers a practical framework to define that ROI, helping you build a solid business case for APM. We’ll walk through establishing your starting point (baselines), setting achievable targets, calculating the benefits, and communicating your progress with clear, stakeholder-friendly dashboards.
Cut Months of Setup into Days—Start with Proven Sparx Application Portfolio Management Templates
ROI Model: Cost Out, Risk Avoided, Value Realized
Effective APM delivers value in three distinct categories. This is the key to understanding the full benefits and business value of APM. To find your true ROI, you simply sum the gains from all three and compare that total against your investments, which includes the cost of tooling, data collection, team training, and change management.
Reduce Costs (Cost Out)
- Removing redundant or overlapping applications.
- Right-sizing software licenses and support contracts (stop paying for what you don’t use).
- Lowering day-to-day infrastructure and operational costs.
Mitigate Risk (Risk Avoided)
- Minimizing security exposure and preventing costly outages.
- Avoiding compliance penalties and negative audit findings.
- Retiring end-of-life platforms that are no longer supported and pose a risk.
Unlock Value (Value Realized)
- Boosting business agility (like shortening the lead time for changes).
- Increasing user productivity and application adoption rates.
- Enabling leaders to make faster, data-driven decisions.
A Key Consideration: If your benefits are spread out over several years, use Net Present Value (NPV) to get a more accurate assessment that accounts for the timing of those gains. A dollar saved today is worth more than one saved three years from now.
Baseline vs. Targets: What to Measure from Application Portfolio and When
To demonstrate progress, you must first establish a starting point. Before launching your APM initiative, capture a detailed baseline. After that, you must track your progress (we recommend quarterly) against the specific targets you’ve set.

Key Baseline Metrics
- Portfolio size: Total applications, including any “shadow IT” you discover.
- Run cost: The all-in cost for licenses, support, infrastructure, and services.
- Risk profile: % of apps with critical vulnerabilities or those past vendor support.
- Agility: Lead time for change, deployment frequency, and change failure rate.
Example Targets
- Reduce portfolio size by 15% in 12 months.
- Cut application run cost by 20% year-over-year.
- Lower the number of high-risk applications to less than 5% of the portfolio.
- Improve release cadence by 30% and reduce Mean Time to Resolution (MTTR).
KPI Dictionary: Formulas & Data Sources
Consistent KPI tracking is impossible when teams calculate the same metric in different ways. Create and maintain a shared “KPI dictionary” to ensure everyone is aligned and calculates metrics consistently.
Cost
- Total run cost = Licenses + Support + Infrastructure + Third-party services
- Cost per user = Total run cost ÷ Active users
- Data Sources: Finance systems, vendor contracts, and usage analytics tools.
Risk
- Compliance score = % of mandatory controls implemented
- EOL risk = Count of components past vendor support
- Data Sources: Vulnerability management reports, GRC tools, and official vendor roadmaps.
Technical Health
- Defect density = Defects ÷ KLOC (Kilo Lines of Code) (or per sprint)
- Integration complexity = Weighted interface count
- Technical debt index from code analysis
- Data Sources: Static code analysis tools, your CMDB, and integration catalogues.
Business Value & Agility
- Value score from stakeholder outcomes and utilization
- Lead time for change and deployment frequency from CI/CD
- Data Sources: Your CRM, user surveys, DevOps pipeline data, and ITSM platforms.
To make this practical, you can store these formulas and thresholds right alongside your metamodel in Sparx Enterprise Architect. Then, use Prolaborate to automate the data imports and reduce manual-entry errors.
Benefits Register: Fields & Cadence
Maintain a benefits register to serve as the central log for value tracking. This register is the core of your conceptual ROI calculator, tracking both expected gains and actual results as they are realized. This simple step is crucial for preventing double counting and making sure someone is accountable for each benefit.
Recommended fields
- Benefit: A clear description (e.g., cost out, risk avoided, value realized).
- Category: The specific area, like ‘license savings’ or ‘infrastructure reduction’.
- Calculation: How is this benefit being quantified?
- The Numbers: Baseline, target, and the actual value achieved.
- Owner & Date: The person responsible and the date it was achieved.
Review and validate this register in your quarterly governance meetings.
Role Based Dashboards

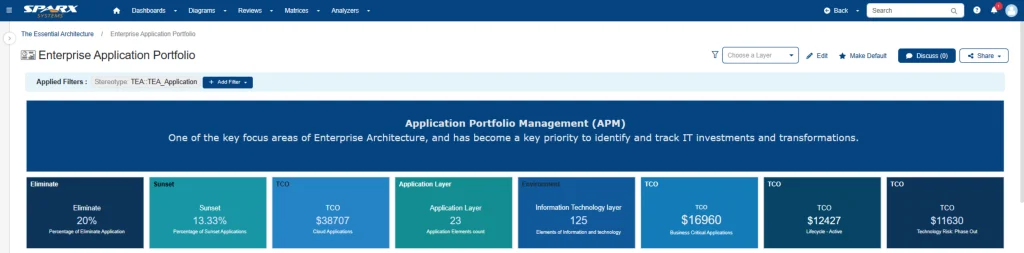
Different stakeholders require different information. Your CFO doesn’t need to see defect density, and your tech leads don’t need to see cumulative savings curves. Your goal is to create visual dashboards for smarter Application Portfolio Management tailored to each audience. For example, you can configure Prolaborate to create:
Executive Rollups
- KPI cards for total benefits realized and current ROI %
- A view of remaining opportunities and the forecast runway
Finance
- Savings by category versus the baseline
- Cumulative savings curves and any variance to the plan
Risk & Compliance
- Vulnerability and End-of-Life (EOL) heatmaps
- Dashboards showing controls coverage and remediation status
Portfolio & Technology Teams
- Bubble charts (Cost vs. Value vs. Risk) with filters
- Actionable lists of high-debt apps and complex integrations
The primary value comes when you enable drill-through. A leader should be able to click a KPI card in a Prolaborate dashboard and link directly to the underlying Enterprise Architect diagrams or discussions to get the full context.
Storytelling with Before/After Snapshots
Numbers tell what happened, but stories explain why it matters. Pair your data with simple before-and-after snapshots that clearly show the decision, the action, and the outcome.
- Consolidated five CRM tools to one; resulting in annual run cost reduction and improved user adoption.
- Migrated legacy reporting to the cloud; saw an immediate infrastructure cost drop and moved to weekly releases.
- Retired an outdated HR system; eliminated a high-risk platform and recovered staff capacity.
As a best practice, each snapshot should briefly name the decision, explain why it was the right decision, and state the measured result.
Review Rhythm & Continuous Improvement
This is not a one-time project. Measuring ROI is a continuous loop.
- Monthly: Application owners should be reviewing KPI outliers. If a metric indicates a problem, it should trigger a clear action: retire, refactor, upgrade, replace, or renegotiate the contract.
- Quarterly: The governance board should use this data to approve new investments and, just as importantly, validate that the benefits from past investments were actually delivered.
- Annually: Recalibrate your scoring models, update your thresholds, and refine your KPI definitions based on what you’ve learned.
Documenting these decisions and their rationales in Prolaborate discussions not only builds alignment but also creates a clear audit trail of your governance process.
Fast track Your APM Efforts and Maximize ROI with Sparx Systems North America’s Expert Consulting
When you have a structured approach to calculating ROI from Application Portfolio Management (APM), it stops being viewed as just a “cost of doing business” and becomes a genuine catalyst for improvement. By methodically establishing baselines, defining your KPIs in a shared dictionary, operating a benefits register, and publishing role-based dashboards, your organization can demonstrate tangible savings, reduced risk, and improved business agility.
With the right tools like Sparx Systems Enterprise Architect, Pro Cloud Server, and Prolaborate, this measurement process becomes part of your team’s daily practice—not a reactive, end-of-year exercise to justify its budget.


