UML Activity Diagrams in Sparx Systems Enterprise Architect
If you’re working with business processes, system flows, or use case logic in Sparx Enterprise Architect, UML Activity Diagrams can help you map it all out – visually, clearly, and fast.
About Activity Diagram
UML Activity diagrams model the flow of activities and actions within a system, showing how work moves from one activity to another. They’re particularly useful for modeling business processes, workflows, and algorithmic logic.
Initial and Final nodes:
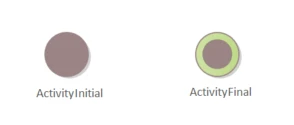
Every activity diagram starts with an initial node and typically ends with a final node (circle with a filled circle inside). These mark the beginning and end of the workflow.
The initial node (filled black circle) marks the start of a user activity, and the final node (circle with a filled circle inside) marks the end of the activity.
Activities and Actions:
Represented by rounded rectangles, these are the work units being performed. Activities are higher-level operations that can contain sub-activities, while actions are atomic units of work that cannot be further decomposed.
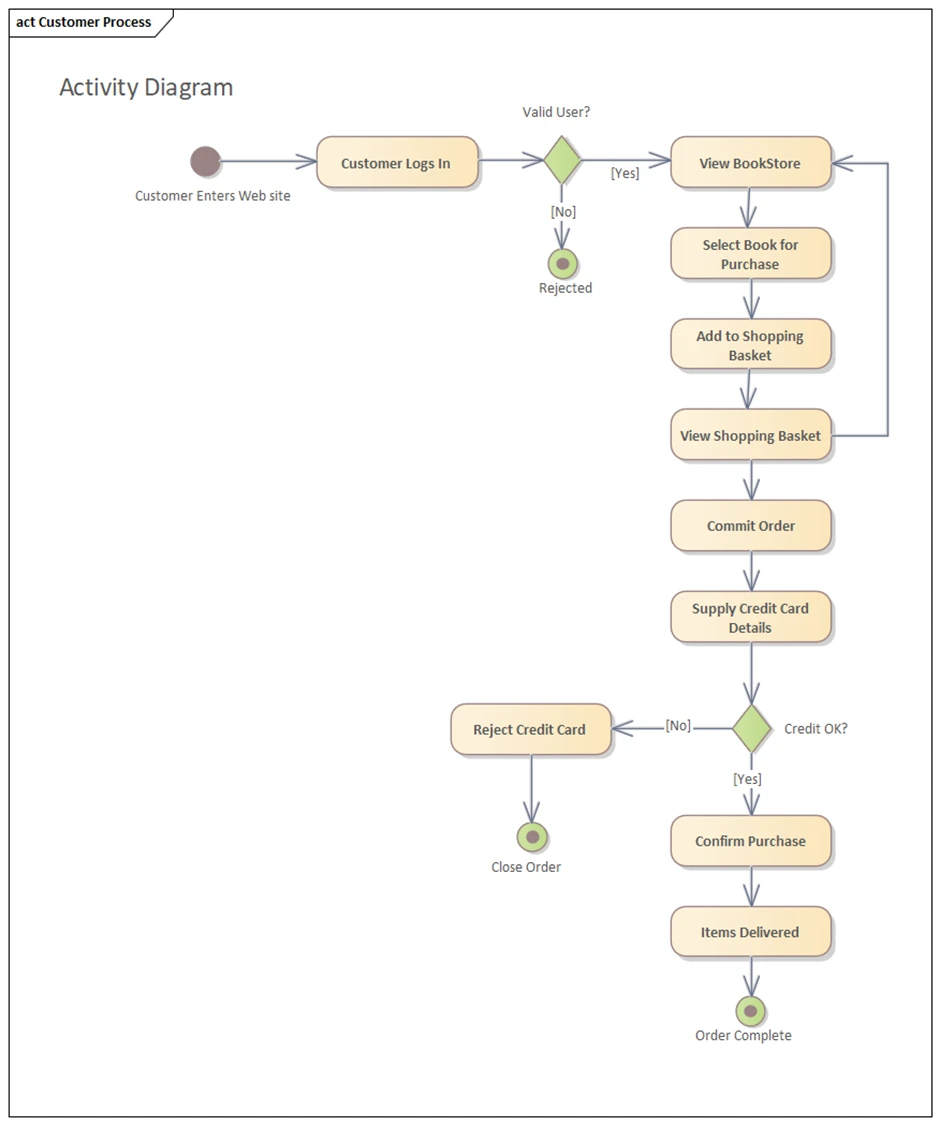
In the example shown below, there are multiple activities (represented by rectangles), that have a linear progression through connectors and flows.
Decision and Merge Nodes:
Decision nodes (diamonds) represent branching points where the flow splits based on conditions.
Merge nodes Each outgoing edge from a decision node should have a guard condition in square brackets like [condition].
(also diamonds) bring multiple flows back together.
Fork and Join Nodes:
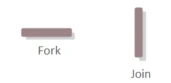
Fork nodes (thick horizontal or vertical bars) split a single flow into multiple concurrent flows, enabling parallel execution. Join nodes (identical bars) to synchronize multiple concurrent flows back into a single stream.
Object Nodes:
Rectangles that represent data or objects flowing through the system - They show what information is consumed or produced by activities.
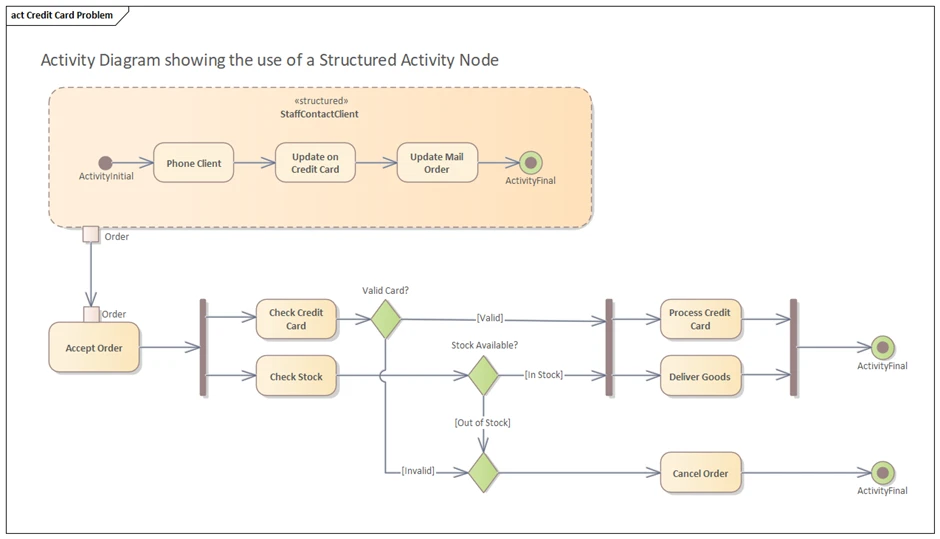
The following example incorporates the control flows and object flows in an activity.
It shows the flow of an object (Order) between activities.
It starts with the container structured activity “StaffContactClient” (after updating the order via phone/credit/mail).
Then it passes into the “Accept Order” activity in the main flow.
This shows how data is being manipulated as it moves between structured and main activities.
Advanced Activity Regions
Beyond basic flow control, UML 2.0 introduces specialized regions that handle complex real-world scenarios:
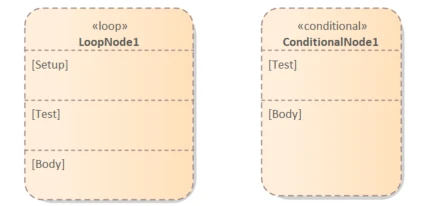
Structured Activity Nodes
These allow you to group related activities into higher-level operations, as shown in the StaffContactClient example below.
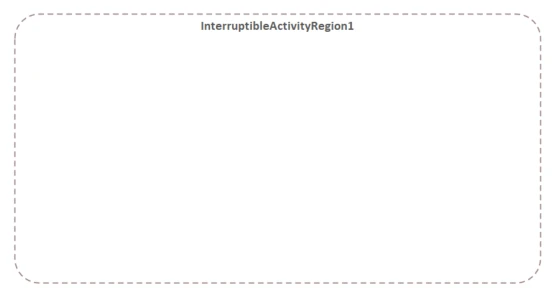
InterruptibleActivityRegions
These regions allow you to model processes that can be interrupted by external events, such as order cancellations or emergency stops. Activities within an InterruptibleActivityRegion can be halted at any point when an interruption signal is received, immediately transferring control to exception handling activities.
InterruptibleActivityRegions are represented by dashed rounded rectangles that encompass a group of activities that can all be interrupted together.
Handling Exceptions and Interruptions
Real-world processes often need to handle unexpected events or cancellations. Activity diagrams provide several mechanisms for this:
InterruptibleActivityRegion in Practice
Consider an enhanced order processing system where customers can cancel orders at any point during fulfillment. The main processing activities (Fill Order, Ship Order, Close Order) are enclosed in an InterruptibleActivityRegion. When an “Order Cancel Request” signal arrives, all activities in the region terminate immediately, and the flow jumps to the cancellation handling process.
Key characteristics of InterruptibleActivityRegions:
Activities within the region execute normally until an interruption occurs
When interrupted, all activities in the region are immediately terminated
The interruption triggers a specific handling flow
Provides a clean way to model exception handling and cancellation scenarios
Let’s delve into how Activities work in sequence.
Connectors and Flow
Sequential Flow: Linear progression through validation steps
Conditional Branching: Multiple decision points with different outcomes
Parallel Processing: Fork splits into two concurrent activities (like check credit card + Check Stocks then after the order is accepted, the flow splits into two parallel paths – Process credit card + Deliver Goods)
Synchronization: Join node brings parallel flows back together
Loop: Payment update creates a feedback loop
Multiple Endings: Different final nodes for success and cancellation
Guard Conditions: Each decision branch clearly shows the conditions [Yes] or [No] that determine flow direction.
Interruption Handling: InterruptibleActivityRegions allow external events to halt processing and trigger exception flows
This diagram effectively demonstrates how Activity diagrams can model complex business processes with hierarchical decomposition, parallel processing, advanced decision logic, and robust exception handling capabilities.