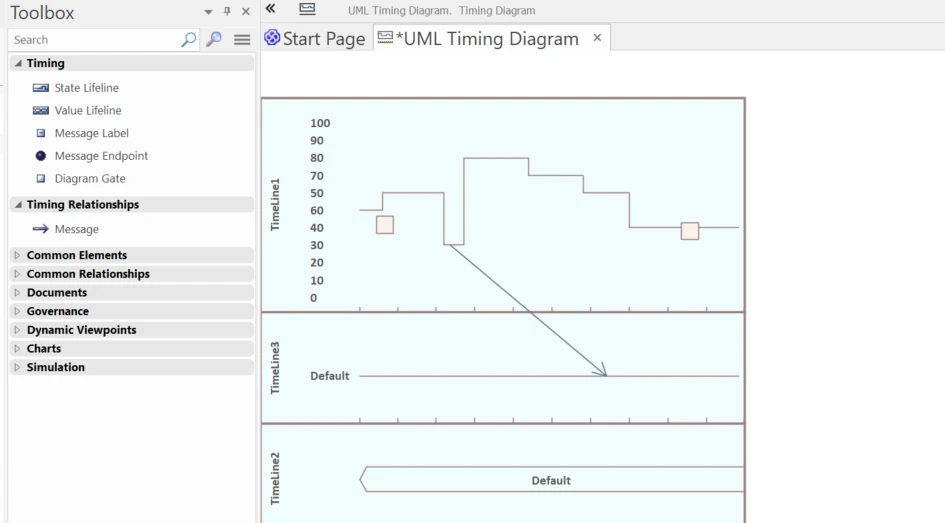
A UML Timing Diagram shows how objects (lifelines) change state or value along a time axis. Instead of a left‑to‑right message timeline, it focuses on state transitions, signal/call arrivals, and the durations between them. Use it when timing is the point: hardware‑driven or embedded components, real‑time protocols, or time‑critical business processes.
Lifelines can be drawn as state lifelines (discrete states) or value lifelines (continuous values). Messages mark when interactions occur; time and duration constraints capture deadlines, delays, and performance limits. The format makes races, overlaps, and latency visible at a glance—something a general Sequence Diagram can obscure.
In Sparx Systems Enterprise Architect, you create this diagram from the Timing pages of the Diagram Toolbox, then place lifelines, states/values, and messages to model the required timing behavior.
Focuses on state/value changes over time, so deadlines, delays, and required durations are explicit and reviewable.
Use state lifelines for discrete modes (Idle → Active → Error) or value lifelines for continuous measures (e.g., voltage, temperature).
Parallel lifelines, message arrivals, and duration bars expose contention, gaps, and hand‑off delays that sequence diagrams can hide.
Attach time and duration constraints (e.g., ack ≤ 50 ms) so performance limits become testable acceptance criteria.
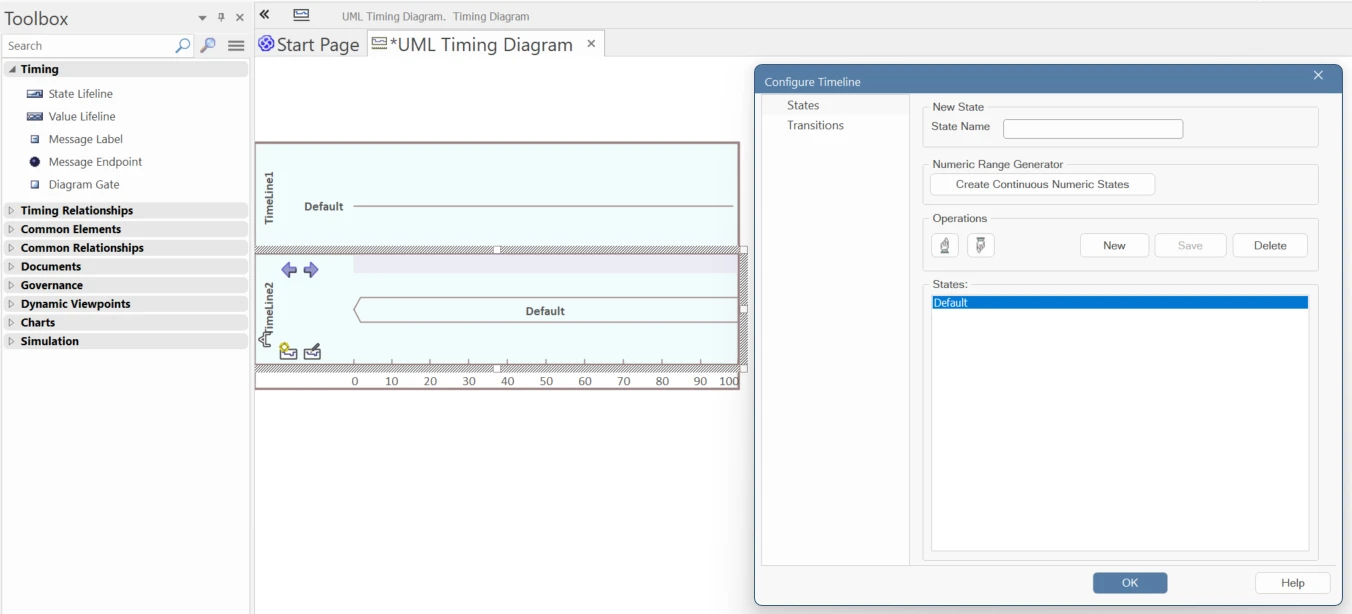
In Sparx Systems Enterprise Architect, messages can link to operations and notes. Teams drill into definitions while keeping timing visible in one view.
| Item | Image | Description |
|---|---|---|
| State Lifeline |
|
Shows an object's discrete states over time. Vertical position denotes the current state; step changes along the time axis indicate transitions. |
| Value Lifeline |
|
Shows an object's value over time. Parallel value levels (or a plotted line) indicate steady values and changes along the time axis. |
| Message Label |
|
An alternative, compact way to denote messages between lifelines. Useful for reducing clutter when many calls/signals are present. |
| Message Endpoint |
|
Marks a message that starts or ends outside the shown lifeline at an undefined external point. One end is on the lifeline; the other is off-diagram. |
| Diagram Gate |

|
Marks a message that starts or ends at a defined external point. Anchored to the border of an Interaction Fragment, indicating entry to or exit from that fragment. |
| Connector | Image | Description |
|---|---|---|
| Message |
|
Indicates a flow of information or control between lifelines at a specific time (e.g., call, signal). Can carry timing notes and constraints to show deadlines or delays. |
The shared time axis lets you see, at a glance, how user actions and system states line up. You can verify deadlines, spot idle gaps, and confirm that acceptance occurs only after the card is present and the code is validated—exactly the kind of timing you’d miss in a standard sequence diagram.
Use these essential steps:
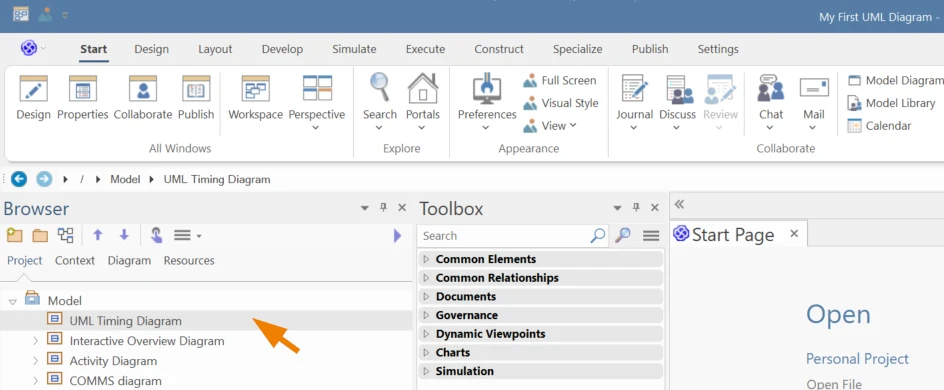
1. Select the Package in the Project Browser where the diagram will live
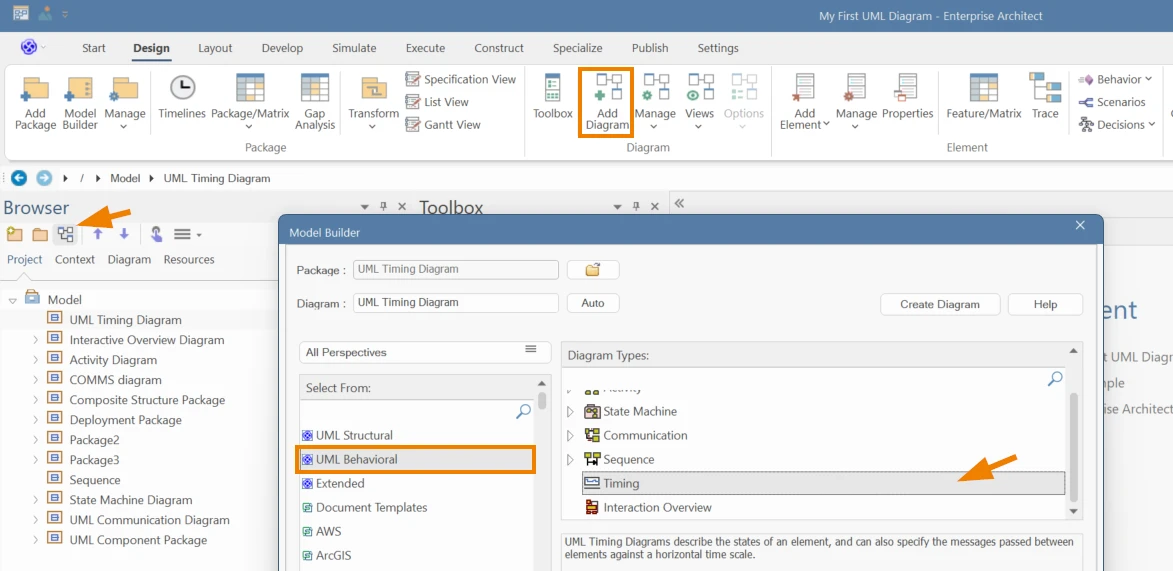
2. Go to Design > Diagram > Add Diagram. Click on the Perspective icon and navigate to UML → Interaction → Timing.
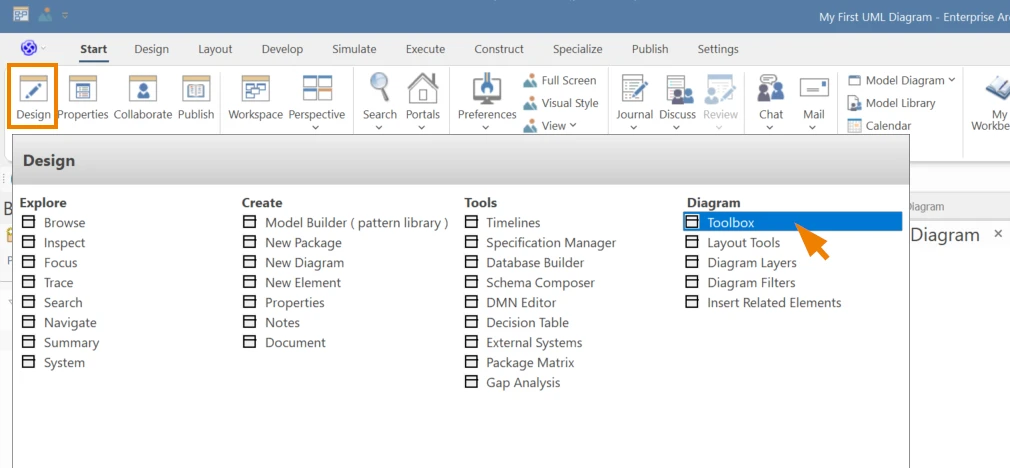
3. Open the Timing toolbox (auto‑opens; or Start → All Windows → Design → Toolbox).
4. Add lifelines: drag State Lifeline or Value Lifeline and name them (e.g., User, ACSystem).
5. Add messages and constraints: draw Messages between lifelines at the required time; add Time/Duration constraints or notes to capture deadlines and delays.
6. Tidy and save: adjust the time scale in diagram Properties if needed, keep labels readable, and Save (Ctrl+S).
Submit Your Request and We’ll Promptly Send a Payment link or Invoice.